Friday, July 30, 2010

Find a place for fun in sun with our latest imagery

It's time for another imagery update, and we have a great batch of new data that will help you scout out vacation spots where you can enjoy the height of summer. In our last update, we highlighted an ancient Egyptian temple; and this time, we've got updates of another Sphinx, an exhilarating hydroplane race, and of course, a beautiful summer resort where rest and relaxation await.


Las Vegas

Hydroplane racing

Baja California resort

High Resolution Aerial Updates:
USA: Seattle, Sacramento, San Jose, Las Vegas, Des Moines, Waukegan (IL), Boston, Portland (ME), Tallahassee, and the Florida counties of Sarasota, Levy, Hernando, DeSoto and Martin
Canada: Banff, Alert Bay
Netherlands: Soest, Maarssen, Bussum, Vlaardingen

Countries receiving High Resolution Satellite Updates:
Mexico, Cuba, Jamaica, Haiti, Dominican Republic, Guatemala, Nicaragua, Venezuela, Brazil, Chile, Argentina, Morocco, Algeria, Egypt, Mali, Guinea-Bissau, Guinea, Sierra Leone, Ghana, Democratic Republic of the Congo, Uganda, Burundi, Kenya, Somalia, Malawi, Zimbabwe, Mozambique, South Africa, Madagascar, Turkmenistan, Kazahkstan, Pakistan, India, Bangladesh, China, Mongolia, Russia, Myanmar, Thailand, Malaysia, Indonesia

Countries receiving Medium Resolution Satellite Updates:
Canada, Nepal

Right now these updates are only available in Google Earth, but will be in Google Maps soon. For a complete picture of where we updated imagery, download this KML for viewing in Google Earth.

New weather features in Google Earth 5.2

With all of the great features in Google Earth 5.2, one that often gets overlooked is the great weather enhancements.
The radar layers have been around since late 2007, and they haven't changed a whole lot since then. In March of 2008 they expanded to more countries, giving you satellite and radar imagery for any place that you want to see.
clouds.jpg
With this latest update, they've added a bit more eye candy. If you fly beneath a rainstorm, you'll actually see rain falling in Google Earth! This requires a fairly powerful graphics card, though I don't know the specifics on that.
Turn on the radar, find a green area and watch it rain! If you're not able to see it, here's a screenshot to show you what it's like:
rain.jpg
For more about this, you can read the full entry on the Google Lat Long Blog.

Historical Maps of Scotland

Visualising Urban Geographies

William Edgar, City & Castle of Edinburgh, 1765

Visualising Urban Geographies is a project that aims to bring together historical data provided by Professor Richard Rodger with historical maps provided by the National Library of Scotland. The project's examples website provides access to a very large number of historical maps of Scotland, many of which you can view using the navigational tools of Google Maps.

Maps of Edinburgh, 1765-1945
The Maps of Edinburgh section includes 16 historical maps of Edinburgh from 1765 to 1945. Each of the maps has been overlaid on Google Maps. The maps include a transparency tool so it is easy to compare the maps to the Google Map tiles underneath.

ExMap Viewer

The Exmap Viewer brings together maps from the National Library of Scotland collection and some useful research tools. Features include: adding your own maps and data; Google Street View; bulk geocoding and integration of the Topocoding API.

It is also possible to set up your own instance of the ExtMap viewer using Google Spreadsheets to store your configuration details. Customisable options include: map start point, map layers; bookmarks.

Map and Google Spreadsheets Data Mashup


This is a hugely impressive map viewer that allows you to create your own map mashup with the National Library of Scotland's historical maps and your own geocoded data from Google Spreadsheets.

The viewer includes some example Google Spreadsheet data that geocodes information about tenement plaques in the Marchmont area of Edinburgh. If you wish to add your own data you just need the id number from your Google Spreadsheet.

London's Cycle Scheme on Google Maps

Barclays Cycle Hire Map

London's new cycle hire scheme started today. 5,000 bicycles are available for hire from around 400 special docking stations around the UK capital. Transport for London have produced this Google Map showing the location of the docking stations.

You can search for docking stations by address or just zoom the map to a location. If you click on a map marker you can get live data about the number of bikes currently available at that station.

Nestoria

Real estate website Nestoria think that a property's proximity to cycle hire stations might play a key role in finding your next home. As such, from today you can find all of the central London cycle hire stations on Nestoria.

If you search for property in London you can now view all the cycle stations near a property on a Google Map.

London Cycle Stations Map

I created this map of the cycle hire stations myself for this Fusion Tables tutorial. I've now added the locations of bike shops to the map. So if you don't want to hire a bike you can buy one instead.

The only other map I'm aware of is the Cycle Hire App for the iPhone. The app uses OpenStreetMaps.

Guide Books on Google Maps

GuidebookPlus

GuidebookPlus is a Google Maps based index for travel guidebooks.

GuidebookPlus maps the page numbers of all the places in guidebooks, such as those published by Lonely Planet and Rough Guide. For example is you choose 'Lonely Planet: Italy' from the drop down menu and zoom in on Italy you can see the page numbers on the map relating to each location.

GuidebookPlus includes a number of other functions. If you want to buy a guidebook for your travels you can use GuidebookPlus to find which guidebook has the most places described in a certain area.

As well as quickly finding the location of places mentioned in guidebooks you can get the driving directions from one location to another, find accommodation, read Wikipedia articles and show only places of a given type of interest.

Take the high road or the low road with Earth view in Google Maps

Draggable driving directions is one of our most popular features in Google Maps. By simply clicking on a route and dragging it, you can choose an alternate - perhaps more scenic or more familiar - route to your destination. This feature wasn’t available when Earth view launched in Google Maps earlier this year, but we’re happy to announce that draggable driving directions are now in Earth view as well. After getting directions, just grab the blue route line with your mouse and drag it onto alternate highways or streets. The route will update automatically, redrawing your path in 3D as you move your mouse.

As an example, one of my favorite trips to make is to Yosemite Valley from my home in San Francisco. For those of you familiar with this route, there’s a steep shortcut called Old Priest Grade that saves time but can be challenging for larger vehicles. Here is the recommended route taking the grade:


By grabbing the blue line with your mouse cursor and dragging it within the map, you can quickly and easily pick a different route. In this case, I prefer to go around Old Priest Grade and take the gentler Highway 120.


The next time you plan to drive, whether it’s a short day trip to park you’ve never visited or a weekend road trip with your buddies, make sure to check the route and switch it up if you’d like. You can change these same directions to Yosemite, or click-and-drag any driving route you create!

Thursday, July 29, 2010

Rain or Snow, Now You Can See Weather in Google Earth

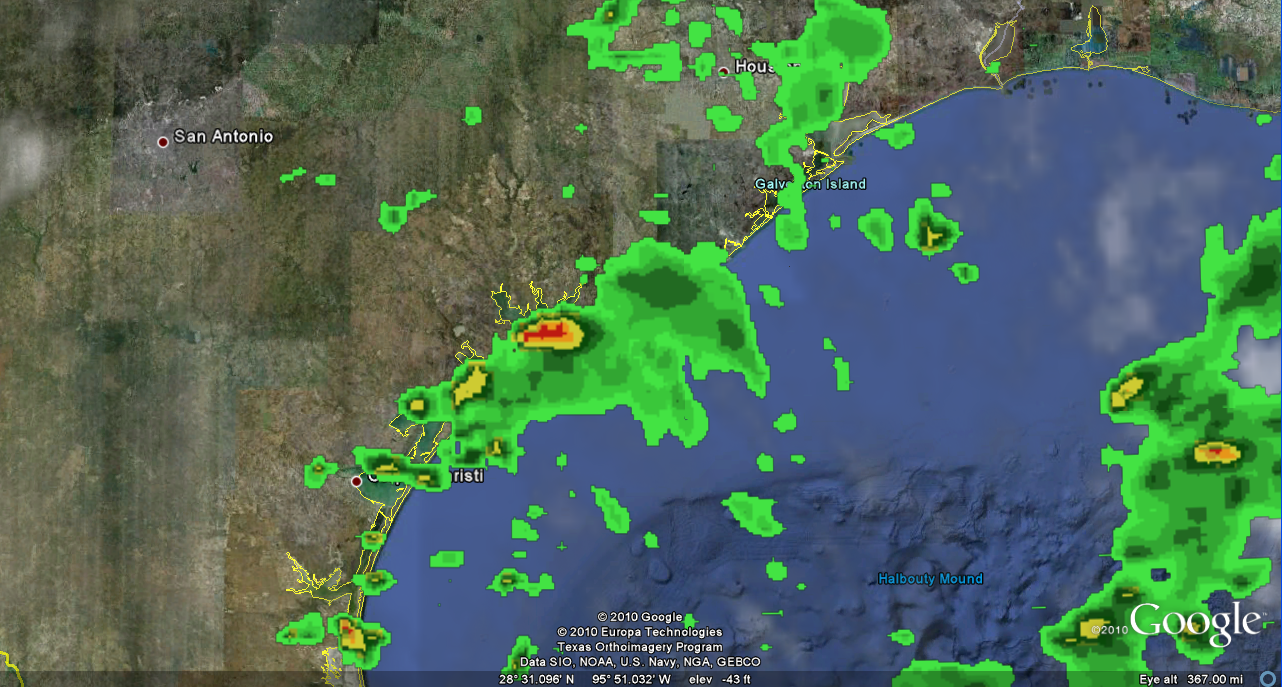
It’s the middle of summer, but for those of us who long for the return of cold winter weather and warm cups of cocoa, throw on your favorite poncho and check out the weather in Google Earth 5.2. The latest version projects images of rain and snow over the areas with those weather patterns as it’s actually happening! First enable the clouds layer, then zoom in to a particular location where it might be raining or snowing. I’m willing to bet London is a likely spot, even these days, or the Lone Star state (pictured below) which is in the midst of tropical storm season. Currently, our precipitation data cover some areas in North America and Europe; you can see if it’s available in certain places by enabling the radar layer.


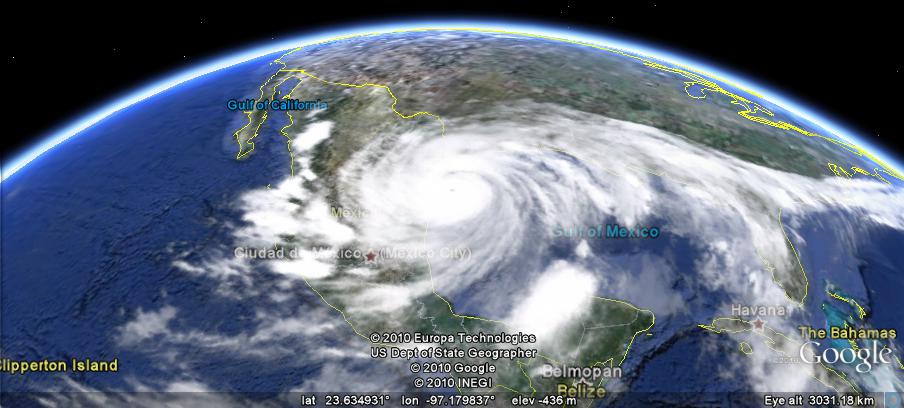
This is a fun and useful tool for anyone planning to travel or who wants to check a specific area where a friend of relative might be visiting or living. For example, in preparation for my recent trip to the American southwest, I decided to check on the status of Hurricane Alex a few days in advance:


Via Google Earth, I could see that the hurricane was entering Mexico and Texas. Zooming close to ground, I saw that the Texas coastline was getting a bit of rain:


Luckily, I missed the hurricane by a couple of days!

You, too, can make like a meteorologist and track wet weather patterns ranging from light drizzle and snow to hurricanes and blizzards in Google Earth. Feel free to give it a try!

3D Satellite View with Google Maps

Stereoluchtfoto's van Amersfoort uit 1932

In July 1932 a plane flew over the Dutch city of Amersfoort and took 160 stereoscopic aerial photographs. Wessel Spoelder has pieced together 32 of these photographs and created this Google Maps mashup.

So if you have your 3D glasses hanging around after viewing Street View in 3Dput them on and check out Amersfoort from above in 3D. If you know Amersfoort you can even search the map by street name.

This is another great Google Map from ab-c media weblab whose panoramicStreet Views of churches in Utrecht is one of the most impressive maps I've seen this year.

The Orient Express Route on Google Maps

London to Istanbul by Train

One of my life's ambitions is to take the train from London to Istanbul following the route taken by the Orient Express. Guardian journalist Benji Lanyado did just that and has created this video map of his journey.

The map itself is just a simple My Map embedded on The Guardian website. The videos however are top-notch and definitely worth watching. They are even better, in my eyes, for having been uploaded to YouTube with the user name pottsy4england (there are bonus points available for the first person who can explain that name in the comments).

The nearest I have got to realising my ambition is creating this Google Map mashup of the route, The Orient Express, featuring a number of videos of cities along the journey. The map is a couple of years old now but still works OK.

Subway Traffic on Google Maps

New York City Subways

Here is another great example from the New York Times of a Google Map created to help illustrate a news story.

Every year, New York City Transit releases a station-by-station breakdown of ridership on the network. This NYT article examines which subway stations experienced a decline in traffic last year and which subway stations experienced growth.

Readers of the New York Times can use the Google Map to query the data themselves. The map gives a great overview of the yearly rises and falls of traffic and users can click on any subway station to view specific traffic data.

The map includes three main views which can be accessed via the menu at the top of the map. You can view a map of where ridership is down, where ridership is up and view the total traffic for the year.

Other New York Times Google Maps