Thursday, August 19, 2010

To 100 million and beyond with Google Maps for mobile

Almost five years ago, we launched Google Maps for mobile to help you get where you needed to go from your phone instead of a paper map. Today, more than 100 million people a month are now using Google Maps for mobile to get from point A to point B, find nearby places, and more.

Over the past five years, Maps for mobile has changed quite a bit, adding more ways to help you explore the world around you. With My Location, you can quickly find where you are on the map with or without GPS. You can put your friends on the map with LatitudeNavigation even turns your phone into a free internet-connected navigation system with voice guidance and Street View imagery.

Google Maps for mobile through the years (click to see larger image).

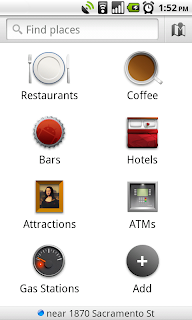
Lately, we’ve been especially focused on helping you find the right place at the right time. With recent additions such as Place Pages, you can now pick a nearby place by browsing information such as opening hours and review snippets for the places around you. It’s easier than ever to find those places with Search by voice or the new Places icon on Android. With this latest Android version, we’re happy to see that you’re now searching for places almost three times as often, doubling how many Place Pages are seen a day.
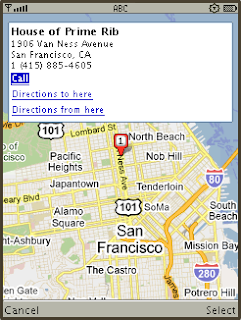

 
Search result page for Java-enabled phones in 2005 (left) and Place Page for Android-powered devices in 2010 (right). 
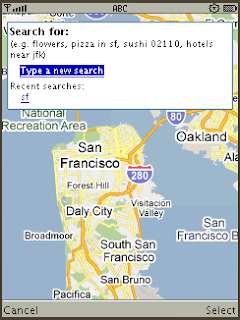

 
Search experience in 2005 (left) and Places for Android-powered devices in 2010 (right).

We hope this is just the start of how Google Maps for mobile will continue to evolve and let you explore the world right from your phone. We’re always inspired by how you’re using Maps, and we’d love to hear about a time when you found the nearest mechanic for a flat tire or discovered that hidden gem of a burger joint. If you have a Google story about when Maps for mobile has helped you, please tell us about it. You can also share quick stories on Twitter @googlemobile, and we’ll share our favorite ones. From all of us here on the Google Maps for mobile team, 100 million thank yous for getting your Google Maps to go!

If you’re a business owner, help millions of people find you by claiming your free Place Page available in Google Maps and our most used mobile “app” -- Google Search. Get started atplaces.google.com/businesses.

Heroic Defenders of Wildlife organization maps oil spill cleanup efforts

For a period of several months, 50,000 to 60,000 barrels of oil per day flowed from the site of the Deepwater Horizon well straight into the Gulf of Mexico. After the initial explosion on April 20th, the first reports of oil sightings on the coastlines began on June 1st. People living and working along the shoreline spanning Louisiana, Mississippi, Alabama and Florida saw clumps of crude oil on their local beaches. That was followed by reports of birds, dolphins, fish and sea turtles covered in slick black oil.

In the aftermath of the largest environmental disaster in U.S. history, environmental groups across the country have been rallying in support of both immediate coastal reparation and long-term solutions for the damage the Gulf Oil Spill has wreaked on the ecosystem. With those goals in mind, Washington, D.C.-based Defenders of Wildlife, an organization dedicated to protecting species and the habitats on which they depend, is doing everything it can to raise awareness and action for greater cleanup and conservation.

The organization is working to educate policymakers about the importance of protecting wildlife and securing a moratorium on further offshore drilling. In addition, Defenders of Wildlife has been issuing ongoing reports on the number of birds, sea turtles and marine mammals found covered in oil along the coast. As many as 400 different species of animals are projected to be impacted by the environmental nightmare. Since massive cleanup activities are being led by a number of environmental groups, Defenders of Wildlife also decided to use their powerful mapping platform called the Conservation Registry to track the collective efforts of all the various groups into one comprehensive map.


Gulf of Mexico Oil Disaster – Oiled Wildlife: *The numbers above reflect only wildlife that has been recovered dead; actual numbers of dead wildlife are likely to be much higher.

Oiled Wildlife Ticker, updated each day to track the numbers of animals that have been impacted by the spill

This Gulf Oil Spill Recovery map was created using the Google Maps API and the Google Earth API. It allows any users, whether they’re part of a non-profit group or concerned citizens who want to report what they observe in their backyards, to upload stories, photos and video to the common shared map. The result is an impressive illustration of all the projects - from beach cleanups to air monitoring surveys to sediment sampling - going on in the region to help rescue and restore affected species and their habitats. The map also shows numerous steps that the Obama Administration is taking to mitigate the near- and long-term impacts of the spill. As the map evolves, you’ll be able to see how the marine environment and coastlines recuperate from collaborative efforts by average people, non-profit organizations and government agencies.


Through this video, our most recent Google Earth Hero, Defenders of Wildlife, shares more about the creation of the Gulf Oil Spill Recovery application. Their hope is that it will not only help people visually understand the scope of the spill and recovery work, but also spur volunteers into taking action and getting involved themselves. Additional data contributed by Defenders of Wildlife, news and user videos can also be found on the Google Crisis Response oil spill recovery site.

Facebook Places using Bing Maps

Facebook has launched 'Facebook Placesaccessible and the new Facebook iPhone application touch.facebook.com site on your moblie device. Select thePlaces button, find the location where you are and check-in. Just like that, the check-in will flow to your profile on Facebook.com complete with a Bing Map, a pin of your location and any commentary you’ve added to your check-in.
Places also includes the ability to see where your friends have checked in, a link to get directions to a place (via Bing Maps) and a Like button for the respective place page. The place information bubbles up to the actual Places page which has a larger map experience, plus an update for you to see all of your friends who’ve visited that location. This means you can see where your friends are checking and discover new places.
Facebook Places Bing Maps
With 500 million users overnight have the ability to check-in to locations providing a wealth of information to you and your friends about businesses, common places to visit and who of your friends is going to the most random locations.

Present the Weather with Google Maps

Produce and Present a Weather Forecast


Have you ever wanted to present the weather? Thanks to this Google Maps app now you can.

Using the application you can drag and drop weather symbols onto a Google Map to create your very own weather map. When your map is completed you can then watch a fly-through of your weather map. During the fly-through you can stand in front of your computer monitor and pretend that you are a real-life TV weather presenter. For added BBC realism you can even give the world the finger.

Currently you can place the weather symbols anywhere in the world but the presentation fly-through only works for the UK. The map developer says however thay he has plans to automate the generation of the fly-through route based on the symbol positions, which will mean that it will work for wherever you place the symbols. There are also plans to add more weather symbols for temperatures and for the wind.

Data Animations with Google Maps

Timemap
Timemap is a Javascript library to help create Google Maps with the SIMILE timeline. The Timemap page on Project Hosting on Google Code has a number of really good examples of how to implement the SIMILE Timeline with Google Maps. A couple of the examples, in particular, are very impressive. One creates a Temporal Heatmap from a Google Spreadsheet and the other has some great Polygon Tweening.

Temporal Heatmap from a Google Spreadsheet

In this example the map markers increase in size to show the cumulative deaths from asbestosis and silicosis in Texas over time. As you move the timeline forward the circular map markers grow to reflect the cumulative number of deaths.

This is a great way to show any cumulative increase in data on a map. I'd really like to see an example that shows the growth in population by country over a number of centuries.

Polygon Tweening

This example uses a custom filter to smoothly tween a polygon between a beginning set of vertices and an ending set. The example doesn't seem to be a demonstration of any particular dataset but I can think of some great ways that this could be used.

This could be used to great effect to show the growth of an urban area over time. I'd love to see this used to illustrate the urban sprawl of London as it has crept out over the centuries to swallow up the surrounding countryside. 

Andy Dell is putting Hounslow on the map

Andy Dell is building some great 3D models of his local area, to the point where the Hounslow Chronicle did a story about him and his work (which I discovered via the 3D Warehouse Twitter account).
andy-dell.jpg
As you can see from the image above, he does excellent work with great attention to detail. The image above (of the Duke of York Pub), notice the roof overhang, expanded bay windows, tables, the Pub sign, the fence in back, etc. It's very well done.
So far 21 of his models have been accepted into Google Earth, which you can view in theGoogle 3D Warehouse.
The rest of Hounslow is still pretty bare in Google Earth, but with people like Andy on the job it'll be coming to life a little more every day.

The World's Happiest Countries Are ...

Yesterday I posted about Survey Mapper's happiness survey, which seems to suggest that Brazil is the happiest country. Here are some more maps exploring the 'happiness' ratings of the world's countries:

World's Happiest Countries

According to Forbes the Danes are the happiest people in the world.

Mibazaar has created this Google Map to display the results of the Forbes Happiest Countries list. The list is based on results from a Gallup World Poll that surveyed thousands of respondents in 155 countries, between 2005 and 2009.

The poll asked respondents to reflect on their overall satisfaction with their lives and asked questions about how each subject had felt the previous day. Mibazaar's map of the results uses numbered map markers so that you can tell at a glance where a country ranks on the list. The countries are also listed in the map sidebar in descending order.

Tweet Sentiments

TweetSentiments.com provides a snapshot view of the world's mood via a heat map from an analysis of Tweets. The site uses Natural Language Processing and Machine Learning technologies to analyse Tweets from around the world and then presents the results on a Google Map.

Happiness Map
happiness map
Denmark also seems to be one of the happiest countries on Adrian White'sHappiness Map (pdf).

Facebook Places

Facebook Places was launched tonight.

Interestingly the screenshots used in the launch and on the Facebook Blog all seem to use Google Maps. However the Bing Community blog says that it is using Bing Maps and seems to have the screenshots to prove it. My guess is that Facebook Places is using Google Maps for its iPhone app and Bing Maps on the Facebook website.

Unfortunately, for the rest of the world, Facebook Places at the moment is only available in the United States.

Facebook Places will allow you to check-in to locations, find friends who are nearby, track location history and find places and venues nearby. If a friend checks in nearby to your current location you will get a notification. Facebook Places will also allow you to tag photos and friends. Tagging friends essentially means that you can check-in your friends when they are at a location with you.

Facebook Places also looks like it will have place or venue pages. Each place will have its own page on Facebook. These place pages will show you who else is checked in right now at this location.

Facebook are launching an API for Places. The Read API is launching tomorrow. The Read API will let you access your check-ins and your friends' check-ins. There will also be a Write and Search API. This is currently in closed Beta.

Places comes with a number of privacy controls. By default your check-ins can only be viewed by your friends on Facebook. However it is possible to change your privacy settings to allow anyone to view your location data. Users will also be notified when they are tagged by a friend. You can then remove the tag if you want. You can also change your settings so that your friends can't tag your location.

Facebook today also announced a number of partners who will be utilising Places. These include Gowalla, foursquare, Yelp and Booyah.

If you have an iPhone you can use Facebook Places with the most recent version of the Facebook application for iPhone. You also can access Places fromtouch.facebook.com if your mobile browser supports HTML 5 and geolocation.

Open Street Map Routing, Directions & Export

OpenStreetMap (OSM) gets even more powerful with directions and routing tools.

Find, View and Export your custom directions
.
Designed Routes for:

  • Car
  • Heavy Goods Vehicles
  • Goods Vehicles
  • Public Service Vehicles (Buses)
  • Motorcycles
  • Bicycles
  • Pedestrian
  • Moped
OSM Powerful Route Finder
Simply have a start and end location - midpoints/waypoints can be included.

OSM Directions of Route
Directions 'explain' your routes, like a satnav would, turn by turn, includes all road names.

OSM Export Your Route
Export, a very useful component lets you export in GPS exchange format (.gpx) or waypoints (.wpt) format.

The map with route (above) example:

http://nroets.dev.openstreetmap.org/demo/index.html?lat=54.6&lon=-3.8&zoom=5&layers=B000TTTTT&v=motorcar&adj=recommended&markers=!50.06626%2C-5.71482!58.64026%2C-3.06984

The Iterative Web App: New Stacked Cards Interface for Gmail on iPad.

In April 2009, we announced a new version of Gmail for mobile for iOS and Android. Among the improvements was a complete redesign of the web application's underlying code, which allows us to more rapidly develop and release new features that users have been asking for, as explained in our first post. Today’s topic for the The Iterative Web App, a series where we continue to release features for Gmail for mobile, is the Stacked Cards Interface on the iPad.

When we announced our new interface for Gmail on the iPad, we requested feedback on how we could improve this experience for tablet devices. In June, we responded with a new compose screen. Today, we’re addressing the top feedback by launching a new “stacked card” interface for selecting and managing multiple conversations.


In the past, performing actions on selected conversations was awkward. There were two similar toolbars on the screen: one on the bottom left and the other on the top right. The former affected the selected conversations, while the latter affected the currently open conversation. Since the toolbars’ buttons looked similar, it was easy to mistakenly use the wrong toolbar. Sound confusing? It was. 

In the new interface, selected conversations are displayed stacked on the right panel for easy organizing, archiving or deleting. The second toolbar is gone so it’s always clear which conversations you’re working with.

This new interface has also been an opportunity for our team to experiment with CSS3 transitions, which give mobile web applications a similar look and feel to native applications. More details on the implementation are posted on the code blog.

To try the Gmail webapp on the iPad, just go to gmail.com in Safari. For quick access, create ahomescreen link. Please note that the new interface is only available in US English for now.