Friday, September 10, 2010

Looking Forward to Fall

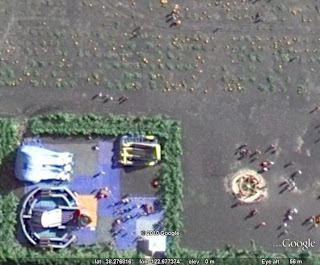
With Labor Day behind us, the summer is officially over for those of us in the United States. No need to fret, though. Autumn brings us many wonderful events - two of my favorites being baseball pennant races and, of course, Halloween. Our latest batch of imagery updates just happens to include a few places that capture the essence of the upcoming season and are getting me excited about all the great times to be had in the months ahead. Check out the images below:

corn maze in Petaluma, California


pumpkin patch in Petaluma, California


giant Louisville Slugger in Louisville, Kentucky


High Resolution Aerial Updates:
USA: Santa Rosa, Spokane, El Paso, Waco, Houston, Richmond, Louisville, Dover (DE), Perquimans County (NC), Pasquotank County (NC), Cass County (MO)
Poland: Warsaw, Lublin, Chelm, Piotrkow Trybunalski, Tomaszow Mazowiecki, Opole, Wroclaw, Swidnica, Walbrzych, Zielona Gora, Leszno, Torun
Sweden: Malmo, Nybro, Ulricehamn, Linkoping, Amal, Karlskoga, Kumla, Nynashamn
Spain: Euskadi, Basque Country
Mexico: Merida, Playa del Carmen

Countries receiving High Resolution Satellite Updates:
Guatemala, Honduras, Nicaragua, Costa Rica, Cuba, Panama, Colombia, Venezuela, Ecuador, Brazil, Guyana, Peru, Bolivia, Paraguay, Argentina, Chile, Senegal, Guinea-Bussau, Guinea, Sierra Leone, Liberia, Ivory Coast, Ghana, Mali, Burkina Faso, Togo, Benin, Nigeria, Niger, Chad, Cameroon, Central African Republic, Congo, Sudan, Eritrea, Ethiopia, Djibouti, Kenya, Uganda, Democratic Republic of the Congo, Rwanda, Burundi, Tanzania, Zambia, Angola, Mozambique, South Africa, Madagascar, Lesotho, Egypt, Libya, Tunisia, Algeria, Morocco, Hungary, Slovenia, Serbia, Bulgaria, Turkey, Russia, Syria, Iran, Turkmenistan, Kyrgzstan, Uzbekistan, Pakistan, India, Sri Lanka, China, Mongolia, Myanmar, Thailand, Vietnam, The Philippines, Korea, Indonesia, Australia, New Zealand, Figi

Countries receiving Medium Resolution Satellite Updates:
Canada, Madagascar, Sri Lanka, Kyrgyzstan, China, Thailand

These updates are currently only available in Google Earth, but they'll also be in Google Maps soon. To get a complete picture of where we updated imagery, download this KML for viewing in Google Earth.

Responding to the fires in San Bruno

Like many friends in the Bay Area and across the country, I’ve been stunned by the images of raging fires in San Bruno. Nearly 40 structures have been destroyed and 120 damaged, with several fatalities and multiple injuries after the explosion of a gas line. More than 100 people have been evacuated to nearby shelters.

This disaster strikes close to home; our YouTube offices are about two miles away from the main gas explosion. We’re thankful that no Google employee was hurt, but remain concerned for the well-being of our neighbors in the area.

We are donating an initial amount of $50,000 to the American Red Cross Bay Area Chapter to help with relief efforts. We’re directing Googlers to the local blood drives today and will be hosting blood drives in our San Bruno, Mountain View and San Francisco offices early next week.

We’ve created this map to show the location of the explosion and highlight nearby shelters and resources. The map is open for collaboration and welcomes additional useful information. We encourage you to embed it in your website or blog. We are also exploring the possibility of obtaining updated imagery of the area to help responders visualize the scope of the disaster.


View San Bruno Gas Explosion in a larger map

Our hearts go out to our neighbors who have been affected by the explosion. We thank the firefighters and first responders who have been working tirelessly to contain the fires and help the residents of San Bruno. You can donate to help here.

Visualise Danish Datasets on Google Maps

eXplorer

eXplorer is a new tool developed by Linköping University to help visualise Danish data sets. The tool is very similar to Google Labs' Public Data Explorer in that it allows the use to visualise data with Google Maps and view a time-line animation of the data.

It is possible to visualise a number of economic datasets with eXplorer. Once you have selected a dataset from the right-hand sidebar you can view the data on a Google Map and in a number of chart formats.

If you press the play button below the chart you can view an animation of the data over time. The data is also displayed on the map with a choropleth layer. It is possible to click on any of the shaded areas on the map to see the corresponding data highlighted on the chart.

Via: microformats.dk

Beautiful new 3D buildings in Las Vegas

Our friends at CyberCity 3D are at it again -- they've just posted some new 3D buildings in Las Vegas and they look great!
vegas.jpg
CC3D created these "deluxe" 3D Las Vegas buildings (actually resorts) for Team Vision Virtual as part of TVV's plan to build out 3D destination travel sites for 10 cities/regions over the next 18 months. TVV and CC3D teamed up earlier this year to build the impressive 3DHawaii site, so a Vegas version of that site could be pretty neat. Team Vision is the "first-mover" in this space and CyberCity 3D is the production partner as well as a content partner with Google.
CyberCity even built a nice tour to guide you through the city. You can download the tour

Create Your Own Google Maps Envelope

Map Envelope

Here is a great way to create your very own personalised envelope, featuring a Google Maps satellite view of your own choosing. Teevio was so inspired by Beste Miray's Map Envelope that they have developed an application that can create a printable map envelope.

The application allows the user to choose their own location and use the Google Maps satellite view of that location as the design of their personal envelope. Once you have selected your location you can write a message. Your message will then be displayed in a Google Maps marker and information window.

Once you have selected your location and written your message you can preview and print your very own personalised Google Maps envelope.

Walking Directions for Android

Google Maps for mobile 4.5 on Android has launched with Walking Navigation, a GPS navigation system for walkers.

To use Walking Navigation choose the 'Walking' option from the Navigation icon in the updated Google Maps. Walking Navigation has a few changes that help when you’re on your feet. Whilst you are walking your phone will vibrate when you need to make a turn.


The map rotates with you as you turn the phone so you can use it like a virtual compass with satellite imagery to look ahead or help pick out landmarks along the way.

Street View Update

There is also an update to Street View in Google Maps for Android. Google have added some smart new navigation aids to move around whilst in Street View. You can quickly navigate Street View by dragging Pegman from the corner and highlighting where you want to go with a lightly shaded 'pancake' on roads or a rectangle on buildings. Let go of the screen when highlighting the front of a building, and you’ll fly there and turn to face it. 


To use Walking Navigation and the new Street View navigation aides you need to visit the Android Market and update Google Maps and Street View on Google Maps.

Via: Walk this way - Official Google Mobile Blog

Walking Directions for Android

Google Maps for mobile 4.5 on Android has launched with Walking Navigation, a GPS navigation system for walkers.

To use Walking Navigation choose the 'Walking' option from the Navigation icon in the updated Google Maps. Walking Navigation has a few changes that help when you’re on your feet. Whilst you are walking your phone will vibrate when you need to make a turn.


The map rotates with you as you turn the phone so you can use it like a virtual compass with satellite imagery to look ahead or help pick out landmarks along the way.

Street View Update

There is also an update to Street View in Google Maps for Android. Google have added some smart new navigation aids to move around whilst in Street View. You can quickly navigate Street View by dragging Pegman from the corner and highlighting where you want to go with a lightly shaded 'pancake' on roads or a rectangle on buildings. Let go of the screen when highlighting the front of a building, and you’ll fly there and turn to face it. 

Google Earth gets a new website

Google has just updated the official Google Earth website with a great new look and a much more clean interface.
ge-site.png
As you can read on the Lat Long Boog, they're encouraging users to explore the five main areas of the site:
• Showcase: Various featured content.
• Video tutorials: Tutorials on how to do basic tasks like create placemarks, record tours, etc.
• More products: Information on related Google products.
• Community: Various ways to connect with other users, such as the Google Earth Twitter account.
• Industries: Information for educators, media, developers, etc.
All in all it's a very nice update, though right now only the English version has been upgraded.

Fast Access to Google Voice with Android Widgets

Mobile is all about getting super fast access to what you’re looking for and Google Voice is no exception. So, today we’re releasing an update to the Android app, which gives you immediate access to your Google Voice Inbox and settings via two new home screen widgets.

The Google Voice Inbox widget brings your most recent voicemails and text messages to your home screen. With the widget, you can now quickly flip through messages in your Inbox, and if you choose to select a message preview, it will open in the Google Voice app.


Fly to...a whole new website for Google Earth

When you think of Google Earth, you might think about flying to the top of Mt. Everest, surveying the ancient Acropolis, or simply finding the house where you grew up. For the past five years, people all over the world have been discovering new places to explore through our community, blogs, news articles and Gallery. Now you can go to one place—our brand newGoogle Earth website—to find everything you’re looking for.

The new site is loaded with lots of great content including images, videos, tours, maps and tutorials on how to get started with Google Earth. We invite you to explore the new site, starting with these five areas:

  • Showcase: Browse our collection of featured content about the Ocean, Moon, 3D buildings and more to see all the ways you can explore the world around you.
  • Video tutorials: Whether you’re new to Google Earth or an expert user, watch our newvideo tutorials to learn how to create placemarks, record a tour, add a 3D building, import GPS data and more.
  • More products: See all the different ways you can experience Google Earth. Did you know you can access the 3D globe from your phone or on Google Maps?
  • CommunityGet connected with other Google Earth fans in our forums and stay up-to-date through our newsletter, blog and Twitter feeds.
Now it’s your turn to explore the website on your own. Right now, it’s only available in English but don’t worry, we’ll be adding more languages soon. Check out what’s new with Google Earth at earth.google.com.


Viewing Large Data Sets with Google Maps

Google Labs - Public Data Explorer
The Public Data Explorer in Google Labs makes large datasets easy to explore, visualize and communicate. The examples provided by Google provide animated Google Maps time-lines that let you explore different datasets geographically and chronologically.

All the examples essentially use the same maps and charts based time-line template to visualise different datasets. Here are just three of the example provided by Google.


Unemployment in the US

This Google Maps time-line lets you view unemployment rates in the US from Jan 1990 up until the present day.

If you press play on the time-line beneath the map you can view an animation of unemployment data over time directly on the map. You can select to compare different states by checking them in the map sidebar.

As well as the map view you can also view animated views of the data in a bar chart, a line graph and in a bubble graph.


GDP & Personal Income

This Google Map allows you to view GDP and Personal Income of U.S. states since 1969. As you can see, from the example embedded above, you can embed any of the visualisations in your own websites or blogs.

World Development Indicators
This Google Map lets you animate a time-line of a number of global data sets. You can use the 'color' and 'size' drop down boxes to switch to different datasets.

Google Earth 5.2 is now out of beta: Version 5.2.1.1588

Back in June, Google released version 5.2 of Google Earth, which introduced us to some great new features such as trackselevation profiles and a variety of other enhancements.
Now, just shy of three months later, Google Earth 5.2 has come out of beta. Most of you were likely running version 5.2.1.1547, and it's now been updated to version 5.2.1.1588. The update tool inside of Google Earth isn't showing it yet, but if you head over to earth.google.com and download it from there you'll be getting the latest version.
google-earth-version.png
Most of the updates are minor bug fixes, but Google is taking this opportunity to show off a few Google Earth Pro features in a bit more detail: Vector Regionation and Image Regionation. Simply put, these are ways to allow you to view vast amounts of information on the screen; Google Earth will show less detail when you're far away, and slowly add more info as you zoom in.
You can read about both features on the Google Lat Long Blog

Celebrating LA's Diversity with Google Maps

Monuments: Diversity, Democracy and Freedom

The City Project has created a Google Map to help showcase Los Angeles' diversity. The map shows the locations of monuments in the city that celebrate diversity, democracy and freedom.

Each official monument shown on the map is an example of a site that demonstrates historic significance because it reflects or exemplifies the diversity of Los Angeles. Monuments have been chosen that are a testament to the important contributions of people of color, women, and workers or because they stimulate and promote a greater understanding of diversity, democracy, and freedom.

You can search the map by location or you can use the links in the map sidebar to zoom directly to a specific monument. The map has missed a trick by not adding an option to view the monuments in Street View, although a photograph and description is provided for each monument on the map. 

The USGS New EarthExplorer

New EarthExplorer

The United States Geological Survey are using Google Maps to display a large number of data sets that can be downloaded from USGS. The data available to download fits in to three main broad categories; Aerial Photography, Map Products and Satellite Products.

The map lets you explore the available data for a specific location. Once you have selected a location you can search against one or more data sets at the same time. You can obtain information about each of the data sets by clicking on the information icon next to each data set.

The Results tab lists the results of your search. 10 records for each data set are displayed at a time. If you then select the 'download' button you can export the metadata in multiple formats including KML, shapefile, and delimited text file.

Hat-tip: Mapperz
______________