Thursday, March 3, 2011

Don't Get Caught Short with Google Maps

Toilet Map

Toilet Map is a Google Map of public toilets in London. The map is available from your desktop, as an iPhone and Android app and from a dedicated mobile site. Toilet Map currently shows the location of nearly a 1,000 public toilets in London.

It is possible to refine the toilets shown by male, female, disabled and whether the toilet is free or has a charge. If you click on a marker you can view details and see the toilet's opening hours.

If you know of a toilet not on the map you can add it by completing a short form.

Find Toilet

If you are ever desperate for the loo in Denmark you will be thankful for this Google Map. Find Toilet is a map of public toilets with some excellent search options.

Using the map it is possible to find a toilet by town or by region. It is also possible to search for public toilets in a radius of any given location. Lastly, you can also search for a toilet by type, for example handicapped or unisex toilets.

Diaroogle
screen shot of Diaroogle
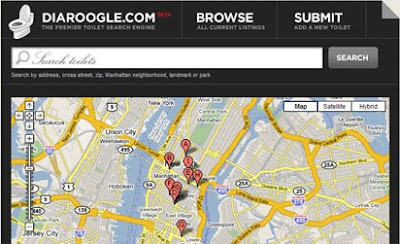
Diaroogle is a community submitted map of Manhattan toilets. The site says that is is for "the discerning, on-the-go defecator who is brave enough to use a public bathroom, but still demands a hygienic and private bathroom experience."

Each mapped toilet tends to come with a general report on its cleanliness and occupancy levels. You can search the map by address, cross street, zip, Manhattan neighbourhood, landmark or park and probably most usefully can access the map from a mobile phone.

LooToGo

LooToGo is a Google Map that shows the locations of public toilets in Germany. The site currently has over 28,000 restrooms in its database.

It is possible to search the map by location. If you click on a map marker you will be taken to the reviews section for that public toilet. If you know of a loo that is missing you can even add it to the map.

LooToGo also comes with an iPhone app, so now you can find your nearest toilet when you are out and about and caught on the hop.

Also See


The Data Buoys on Google Maps

National Data Buoy Center Map

The National Oceanic and Atmospheric Administration (NOAA) National Data Buoy Center (NDBC) operates, and maintains a network of data collecting buoys and coastal stations. The stations measure wind speed, direction, and gust; barometric pressure; and air temperature. The NDBC are using Google Maps to show the locations, and to allow you to view the collected data, of NDBC buoys and the buoys of other providers around the world.

The map allows you to filter for stations by program and/or operator. You can choose to view only the stations from a particular program or show only the stations belonging to a particular owner. It is also possible to display or hide the station identification labels on the map by selecting the Show Labels option.

If you click on a center's map marker you can view the most recent data collected. The map also includes an option to share or save the current map view. 

Location Based Reminders

Geoloqi

Geoloqi is an iPhone app with some great location sharing features. The features of Geoloqi include Geonotes, automatic Foursquare checkins, and private real-time GPS tracking. 

Similar to Glympse, Geoloqi allows you to share your location with those you want to, for a limited time. Your friends can then view your location on a Google Map only for the time that you have defined.

The Geonote option allows you to leave a message in a location and have it e-mailed, texted or pushed to you when you get to that location. You can therefore send yourself a message reminding yourself to pick up milk. You can set the location so that you receive the Geonote when you are passing the store. Or you could leave yourself a note at work reminding yourself about an important task.

Google Earth and the Middle East

The Middle East is where Google Earth has perhaps had the deepest geopolitical impact since its introduction in June 2005. In these 5+ years, the wide availability of high resolution imagery of the region to anyone with an internet connection has caused a slew of governments to fret, and not just the Arab dictatorships — Israel and the UK have also worried, as we’ll see.

In his New York Times op-ed column on Wednesday, Thomas Friedman calls Google Earth one of the “not-so-obvious forces” behind the revolutionary fervor currently gripping the Middle East. The reason cited by Friedman: in 2006, Google made visible the opulent palaces of Bahrain’s ruling family to a populace in the grip of a housing shortage. Outrage ensued, albeit online. The inequalities were simply too striking.
Friedman doesn’t mention the most interesting aspect of this episode: The story only gained traction after Bahrain’s embarrassed sheiks, in a typically autocratic move, ordered the countries ISPs to block access to Google Earth’s imagery, in August 2006. (I wrote about the story here and here). The response was a perfect example of the Streisand effect: Suddenly, everybody in Bahrain was curious about what they weren’t allowed to see. One enterprising activist took screenshots of the imagery (still available to everyone outside bahrain) and turned it into a PDF, which became an instant email hit. (You can still download it from Ogle Earth’s server via this story). After three days, Bahrain’s rulers were humiliated into restoring access to Google Earth.
This is just one anecdote of many that Friedman could have used — but for some reason, it is the Bahrain story that has recently been doing the rounds again, for example in the just-launched The Daily for iPad.
What about the others? Here’s a quick tour of Google Earth’s uses in the Middle East this past half decade.
Tunisia: You know what Google bombing is. In 2008, activists did something similar in Google Earth, “Google Earth bombing” the palace of (now ex-) president Ben Ali with YouTube testimonies of political prisoners. Anyone who zoomed in on his palace would see geopositioned YouTube icons, each one ready to play a video detailing the nastiness of his regime.
Sudan: Sudan has had a rather schizophrenic relationship with Google Earth. For a long time, Google Earth was not available for download in Sudan — not because Sudan’s government blocked it, but because US export restrictions made it illegal for Google to offer it. At the same time, recent satellite imagery of burned villages in Darfur as the Sudanese regime waged war on its own citizens, highlighted by Google through new default layers, brought that conflict home in new ways to everyone except the Sudanese.
Iraq: Iraq is one of the few parts of the globe not to regularly receive new imagery in Google Earth. (Afghanistan is another). The reason for this dates back to early in 2007, when British troops in Basra said they had found CDs with screen dumps of Google Earth imagery of their camps in the local market, arguing that insurgents could use this to fine-tune their mortar attacks. Never mind that the imagery was over two years old, and that it was available for sale elsewhere: In the only proven case of active censoring by Google to date, the company removed all post-war imagery in Iraq, replacing it with older imagery. Eventually, the imagery in question was removed from sale by other vendors as well.
Yemen: In Yemen, using Google Earth to help secessionist rebels got one guy 10 years in jail. But he wasn’t even the first to try.
Iran: Never mind that until a few weeks ago, Google Earth was not available in Iran (US export restrictions, again): Some Iranians have long been upset that the Persian Gulf is labeled not just with that name in Google Earth… but also as the Arabian Gulf, which is the name taught in schools in the UAE and the rest of the non-Persian Gulf states. Google using both place names, with an explanation why, simply didn’t cut it for these Iranians, and the result was a massive online petition to demand that Google to remove the offending “Arabian Gulf” moniker. When I last checked, 1,242,141 people had signed the petition. Google’s response: A detailed naming policy, which unsurprisingly did not appease Iran’s foreign ministry.
Imagery in Google Earth has also been used to monitor and publicize Iran’s nuclear program. (See herehereherehere and here.)
Saudi Arabia: A Saudi researcher caused a stir when he used Google Earth to check whether some of Saudi Arabia’s main mosques were accurately aligned in the direction of the Qibla, i.e. Mecca, and found that some were wanting.
Syria: Satellite imagery in Google Earth has been used by various actors as publicly available evidence to convince the public that Syria’s government was up to no good, such as building a secret nuclear power plant with North Korean help (now bombed by Israel), or allegedly letting Hezbollah hoard Scud missiles.
Israel: Google Earth’s user-contributed layers have been used by sympathizers of the Palestinian cause to influence the narrative of the history of the Israeli-Palestinian conflict: In 2006, an exhaustive annotated list of Israeli settlements in the West Bank was added to the Google Earth Community layer; in 2008, another layer purported to show Arab villages in Israel that had been ethnically cleansed during the war that followed Israel’s declaration of independence. One town, Kiryat Yam, was apparently added in error to the list, but that did not stop the town from trying to sue Google for slander, while other pro-Israel interest groups accused Google of anti-Israel bias (though they did so on ungrounded assumptions.)
Israel has long had special treatment when it comes to the resolution of publicly available satellite imagery of its territory. Due to an American law, the Kyl-Bingaman Amendment, US imagery providers cannot currently sell imagery of Israel that is better than 2 meters per pixel in resolution, which is artificially lowered from the maximum resolution available by the same satellite over the rest of the world. Israel is the only country that has this exemption. Not even US nuclear power plants have this kind of legal cover.
One oft-cited reason for this need for “protection”: Stories showing militants bragging about how they use Google Earth to plan their attacks. The only problem is, 2m-resolution imagery is plenty accurate if you are trying to plan a rocket launch out of Gaza.
In sum, Google Earth has had quite an impact on the region. My own guess is that geographic awareness of the region has greatly improved, not just globally, but by Arabs themselves. On the Yemeni island of Socotra in February 2009, I walked into the only internet café in a 400km radius. The first screen I saw had Google Earth’s familiar globe on it, with rapt teenagers steering it, doing their homework. These kids’ perspectives of the world, so radically different from their parents, are one major factor driving the current revolutions in the Arab world.

Fresh imagery from Christchurch

In the wake of the earthquake that struck Christchurch last month, GeoEye captured some fresh imagery of the area and has now made it available to everyone.
While the imagery is a bit cloudy, it really gives a sense of the widespread damage in the area. These images were captured two days after the quake, on February 24.

christchurch.jpg

To view the imagery in Google Earth, they've made a few files available for you to download:
As Frank mentioned on the Tahina Expedition blog a few days ago you're encouraged to contribute to the families affected by the quake on the Christchurch Earthquake Appeal site.

Ski the slopes in Google Earth


Heading for the slopes this winter? Put on your warm hat, grab your mittens, rent those skis, and bundle up in your warmest jacket … and don’t forget your GPS tracking device! When you hit the slopes this winter, track your route down the slopes and share your animated ski tracks in Google Earth.

This past weekend, a couple of Googlers and I headed up to Lake Tahoe, CA with a few GPS devices. We recorded some of our favorite ski runs and animated our tracks in Google Earth. You can check out all of our animated tracks in the video below, or download the KML to play the tracks in Google Earth.


Capturing a GPS track is easy -- just make sure that you have a GPS tracking device on hand before you hit the slopes. A Garmin® or Magellan® device works best, but you can also use a GPS tracking application on most mobile phones. My Tracks on Android works well, or if you have an iPhone, try using MotionX-GPS.

When you get to the top of the mountain, start recording your track. Place your phone or device in an outside pocket, preferably separate from another device. When you get to the end of your run, stop the track. Or, if you prefer to track the entire day, keep the GPS track running. Most of us decided to keep our tracks running the entire day so we could focus entirely at the task at hand - skiing.

After a full day of skiing and snowboarding, we grabbed some hot cocoa from the lodge and headed home, where we imported our tracks into Google Earth. My fellow Googler, David captured his GPS data with My Tracks, and imported the data by dragging and dropping a .gpx file into Google Earth. We then started playing with the new GPS track animation featurelaunched in Google Earth 5.2, and customized and animated our ski tracks just the way we wanted them. Take a look below at how David customized the line color and label of his track. (He even personalized the tracking icon to make it look like an actual skier!)


We also animated our tracks by creating a tour, which we customized by changing the camera tilt angle, camera range, and tour speed in the preferences dialog. Here’s a helpful hint: if you want it to seem like you went faster, create a tour with a high speed setting to view your track in fast-forward.

Next, we used Google Earth’s Elevation Profile feature to get a better idea as to the difficulty of the runs we skied that day. With GPS tracks, the feature can show both an elevation profile (shown below in red), and a speed profile (shown below in blue). Looking at the red elevation profile below, as you ski around the mountain, there is quite a bit of elevation change. We then counted the total number of peaks in our track’s elevation profile to discover how many runs we skied in one day.


Don’t ski or snowboard? Don’t worry! You can track other exciting winter activities in Google Earth. I’ve never been a big skier, but I love to snowshoe and go dog sledding. Check out the dog sledding tour I created below, paired with a photo of my actual dog sledding experience.


We had so much fun tracking our winter adventures in Tahoe that we even tracked our bus ride home to San Francisco. We were sorry to leave, but I knew we’d be back to trace new paths in the mountains next year -- or even next weekend!

Geospatial Revolution: Episode Three Released

Once again, right on time, Penn State Public Broadcasting has released Episode Three of their excellent "Geospatial Revolution" project.

If you've missed either of the first two episodes, I strongly suggest you go back and watch them. Episode One covered a wide overview of "how" and "why" questions regarding geospatial technologies, and Episode Two dug into more specific examples including the City of Portland and the well-known shipping company UPS.
Episode Three covers a variety of safety and war-related topics, such as:
• "Mapping the Road to Peace"
• "Waging Modern War"
• "Serving and Protecting"
• "Staying Safe"
You can watch each segment individually on their site, or watch the full 15 minute video below: