Thursday, July 15, 2010

Bing Maps - Data Connector - SQL Server


Bing Maps - Data Connector is an Open Source + Open Data project focused on connecting the power of Bing Maps Silverlight Control to the spatial query capabilities of SQL Server 2008.

Bing Maps Data Connector SQL Spatial

Bing Maps Data Connector SQL Spatial
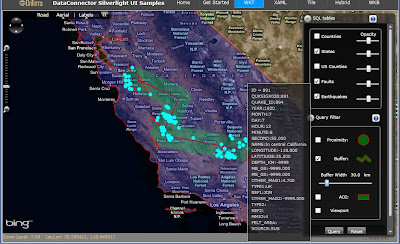
The Live Example - Finding Earthquakes using a user defined Buffer.
Solid Red line is Line to be buffered, green is the buffer, cyan is individual earthquake and associated attribution (date, size, duration).

The three basic parts of this project are the DataBase (SampleGeographyData), the WCF Services (DataConnectorWCF), and the Silverlight Client (DataConnectorUI2). The DataConnectorWCF and DataConnectorUI were developed using Visual Studio 2008 and the data base requires SQL Server 2008.

Bing Maps - Data Connector - SQL Server 2008 Query
These datasets imported to SQL 2008 were chosen to provide useful common data resources as well as examples of each type of spatial feature: points, lines, and polygons.

Additional data resources are easily added to SQL Server. The import utility used for this project was FME Translator from Safe Software.
http://www.safe.com

The data was imported as spatial type geometry and then corrected as required to make valid before updating to an additional geography spatial column. EPSG:4326 is the SRID used for all tables and constraints were added to enforce this srid. The end result is two spatial columns, “the geo” as geography, and “the geom” as geometry. Once imported the data was modified to include an “ID” column suitable for use as a primary key necessary for spatial indexing. For the sake of uniformity each table was also modified as necessary to provide a ‘NAME’ column. For the thematic polygon example an ‘AREA’ column was added to each of the polygon tables. Finally, spatial indices were added to the geography and the geometry columns.

There are lots of examples and blogs that explore Silverlight Mapping as well as resources for SQL Server Spatial. However, the WCF middle tier is not as well represented, which is the reason for publishing this project. The DataConnectorUI2 example Silverlight UI is a Navigation Project with examples of connecting to each of the sample WCF Services.

1. WKT example uses 'Well Known Text' to transmit SQL query results to the client.
2. XAML example transforms SQL query results into XAML, and then transmits as a XAML MapLayer.
3. Tile example builds raster png images in 256px x 256px tiles from the SQL query results. Tile Service feeds these to the client as MapTileLayer.TileSources endpoints. Tile has examples of both cached tiles and dynamic tiles. The thematic option will build dynamic tiles, otherwise tiles are cached in SQL Server as acquired.
4. Hybrid example combines tiles and XAML. Lower zoom levels use tile service for better performance with large data sets while higher zoom levels switch to XAML service to take advantage of vector interactivity.

Bing Maps - Data Connector - SQL Server 2008 Query
These datasets imported to SQL 2008 were chosen to provide useful common data resources as well as examples of each type of spatial feature: points, lines, and polygons.

Additional data resources are easily added to SQL Server. The import utility used for this project was FME Translator from Safe Software.

The data was imported as spatial type geometry and then corrected as required to make valid before updating to an additional geography spatial column. EPSG:4326 is the SRID used for all tables and constraints were added to enforce this srid. The end result is two spatial columns, “the geo” as geography, and “the geom” as geometry. Once imported the data was modified to include an “ID” column suitable for use as a primary key necessary for spatial indexing. For the sake of uniformity each table was also modified as necessary to provide a ‘NAME’ column. For the thematic polygon example an ‘AREA’ column was added to each of the polygon tables. Finally, spatial indices were added to the geography and the geometry columns.

There are lots of examples and blogs that explore Silverlight Mapping as well as resources for SQL Server Spatial. However, the WCF middle tier is not as well represented, which is the reason for publishing this project. The DataConnectorUI2 example Silverlight UI is a Navigation Project with examples of connecting to each of the sample WCF Services.
  1. WKT example uses 'Well Known Text' to transmit SQL query results to the client.
  2. XAML example transforms SQL query results into XAML, and then transmits as a XAML MapLayer.
  3. Tile example builds raster png images in 256px x 256px tiles from the SQL query results. Tile Service feeds these to the client as MapTileLayer.TileSources endpoints. Tile has examples of both cached tiles and dynamic tiles. The thematic option will build dynamic tiles, otherwise tiles are cached in SQL Server as acquired.
  4. Hybrid example combines tiles and XAML. Lower zoom levels use tile service for better performance with large data sets while higher zoom levels switch to XAML service to take advantage of vector interactivity.

in3d's work in the Napa Valley


in3d.com is a company that you may not have heard of, but with the kind of work they've just released you'll certainly be hearing more about them.
in3d is a geosocial media development company that works with a variety of clients in northern California, including wineries, businesses and towns. Their site won't be going live for a few weeks, but you can already see some of their remarkable work in the video below, which showcases the Napa Valley region:


So far they have built around 40 locations in the region, and all of these buildings can be found in Google Earth. However, they don't have a KML to help you view them all easily. That would be a nice touch, and I would imagine that it (or something similar) will be available when their site launches later this summer.
3D development is a rapidly growing field, as we showed you last week. This kind of competition is good for everyone, as it will result in more high quality models for all of us to enjoy.

links for 2010-07-16


Preparing for emergencies with Google Earth Enterprise

(Cross-posted from the Google Enterprise Blog)
Editor’s Note: Brant Mitchell is Associate Deputy Director of the State of Louisiana Department of Homeland Security. The state of Louisiana Department of Homeland Security is a Google Earth Enterprise customer that leverages Google Earth Enterprise for emergency preparedness and now becomes the first Google Earth Enterprise customer to create a Google Earth Enterprise globe specifically for the public.

For the last three years the State of Louisiana has provided our first responder community a secured access to Federal, State and local geospatial data and high resolution imagery of Louisiana through a Google Earth Enterprise client. In preparation of hurricane season, Louisiana is pleased to announce that we have launched the first public version of a Google Earth Enterprise platform.

Louisiana Earth was released as part of the state's "Get a Game Plan" campaign, to assist citizens in creating evacuation plans by providing access to all of the states evacuation routes, sheltering points historical hazard data and other information that is essential during an evacuation such as locations of and available occupancy of hotels, gas stations, pharmacies, grocery stores, veterinary clinics and banks.

Louisiana Earth will also serve as a mechanism to relay critical data during disasters to help inform the public on the status of response and recovery efforts. Using the Deepwater Horizon Rig incident as an example, there is existing data that Louisiana is making available which includes the latest oil sightings from aerial observations, oyster bed closures, as well as critical environmental data such as bird nesting areas.

During hurricanes and other natural disasters, Louisiana will be able to provide information such as the location of points of distribution (PODs), food stamp offices, unemployment claims offices, disaster recovery centers as well as the status of parishes' power outages as an example.


Finally, while the primary purpose is to utilize Louisiana Earth as a mechanism to provide critical data during emergencies, it will also be utilized to promote Louisiana. We will constantly be adding data that the public can use to take advantage of the many activities and events, such as festivals, that are available in Louisiana.

Louisiana Earth already has information on all of the state parks which consists of lodging accommodations, hiking trails, and camping sites. Historical data and cultural events will also be included and will continue to be updated.

To access Louisiana Earth, go to laearth.la.gov.

Making Tracks: New KML Extensions in Earth 5.2


The release of Google Earth 5.2 had a lot of new features, so many that we had to write three different blog posts just to cover it all. Well, OK, four with this one. One of the most exciting features from a developer standpoint is the new KML extension, .
We wanted a better way to represent movement on and above the globe. Time animation works well, but from a KML standpoint it required very bulky files. In order to “move” a , you created a new for each time segment. Your didn’t actually move, it merely was replicated at a different place. This made animating your path rather cumbersome. Instead, we wanted a smoother experience, and one that allowed you to truly animate a . So, we created . To get a real sense of the power of , check out this video.

As you can see, a (a is a in KML) of an airplane moves smoothly along the . Let’s take a look at some KML:
My first track
#mytrackstyle
de>absolute 2010
o-04-07T23:30:55Z
Z 2010-04-07T23:31:3
2010-04-07T23:31:1
32Z
2010-04-07T23:31:52Z
-83.671639 1.675732 7.827881000000001 -83.67233299999999 1.675678 4.94
2010-04-07T23:32:11Z ...
3848000000001
-83.672904 1.67574 3.982666
-83.67346499999999 1.675781 4.463257
track.kmz/files/mymodel.dae
-83.67400600000001 1.675855 3.501953
...
...
/Users/mmarks/Documents
/rack>
mark>
e
Track is a parallel array. The first element matches the first element, the second with the second, and so forth. The element identifies the point on the time slider, and the the matching location. Google Earth draws a line between each position visible in the time slider. Track also supports , which allows you to define the heading of a model at any point along the way. If not defined in , Google Earth will change the orientation of the Model based on the direction between the current position and the one previous.
Since you’re only creating one Track element, instead of re-creating a bunch of elements for every time segment, your KML files will be much smaller. In fact, the more coordinates you have, the more benefit you’ll see from it.
One more feature that is really compelling is that you can add elements to . allows you to add a matching array of your own data. In the sample posted here heart rate, cadence and power are added to each point, and when Elevation Profile is turned on in Google Earth, it allows you to view that data as well, as you can see below.

For more information, check out the session Josh Livni and I did at Google I/O, and the KML reference for and .
Mano Marks, Geo APIs Team

The World's Crime on Google Maps


MyLocalCrime is a Google Maps mashup showing the locations of crime around the world. The site maps crime collected by SpotCrime.

MyLocalCrime is a crime data aggregator. The site collects the crime incidents and plots them on a map. Users can also sign up to receive e-mail alerts for their location. If you enter your location in the search box the site will display the local crime tagged to where the crimes were committed.

The crimes are indicated by categorised map markers. The categories of crime mapped are Arson, Assault, Burglary, Robbery, Shooting, Theft and Vandalism. If you click on a map marker you can read more about each individual crime.