Wednesday, March 30, 2011

How to Make a Census Map

WNYC 2010 Census Map

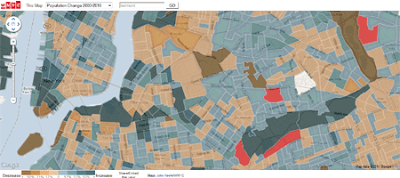
In my extensive round-up of 2010 census maps yesterday I missed one very good map. WNYC has used Google Fusion Tables to create a great Google Map of the census data for the city of New York.

The map allows you to view heat maps of demographic changes in New York over the last ten years. The map allows you to view population change and changes in race / ethnicity in each of New York's census tracts.

If you are interested in how the map was put together John Keefe has written a great post on Making the WNYC Census Map.

Also See

Data Journalism & the 2010 Census

The Colosseum in Street View

Google have added new Street View imagery in Italy and France. This latest imagery has been captured by the Street View trike that allows Google to go off road and obtain imagery from historical sites, such as inside the Colosseum in Rome.

If you want a quick tour of the Colosseum check out this animated pan of the arena in Street View. 


The Colosseum

Other highlights in Italy include: the birthplace of Rome, the Palatine Hill, theAppian Way, the Thermae (Baths) of Diocletian and the Ponte Vecchio in Florence.

In France you can visit the beautiful château of Fontainebleau.

Via: Google LatLong

Google Maps & Twitter

Twitter Nano

Twitter Nano lets you read real-time Tweets from anywhere in the world. Using the provided Google Map you can zoom in on any location and start reading the latest Tweets posted from there.

As well as dragging and zooming the map you can also use the search box to enter a location. The Tweets for each location appear beneath the map, scrolling down with a nice transition effect.

_____________

RPG with Google Maps

Geo Hunters
GEO Hunters is a free role playing game for the iPhone that uses Google Maps satellite views to create a fantasy world based on your location.

In this game monsters have invaded your neighborhood and you are either a warrior, skilled hunter or crafty wizard. Your goal is to protect your turf by amassing your own monster army. As well as fighting the game's monsters you must also compete against other players to become the top ranking player.

The game is compatible with the iPhone, iPod touch and iPad. 

Monday, March 28, 2011

Your Phone Company is Tracking You

Verräterisches Handy

German Green party politician, Malte Spitz recently got a court order forcing Deutsche Telekom to reveal all the location data it had collected from his mobile phone. German newspaper Zeit has used six months of this data to create a Google Map showing how Spitz' movements were tracked over half a year.

The map animates Spitz' movements over the six months and includes a time-line that lets you check his location on any day and at any time of the day, during the six months. The amount of data collected is amazing (some would say frightening). His location was logged 35,000 times just in that six month period.

The amount of location detail collected by the mobile phone companies means that, for example, we can follow in incredible detail a journey Spitz took on the 31st August 2009 from Berlin to Erlanger.

All privacy issues aside, the Google Map created by Zeit is very impressive. The time-line allows you to visualise Zeit's location on the map for any day and at any time. The animation of the six month's of data includes a speed control, which is useful if you want to animate the whole six months. You can set the animation to play at full-speed and watch as six months of Malte Spitz's life flashes by.

Christchurch Aerial View on Google Maps

Christchurch Post-Earthquake Aerial Photos

The Royal New Zealand Air Force flew a C-130 Hercules at 500 feet over Christchurch two days after the 22nd February earthquake, capturing imagery of the damage suffered by the city. As you can see from the shot of Christchurch Cathedral above the imagery provides an incredibly close aerial view of the city.

Koordinates has created this Google Map that lets you view the aerial imagery on Google Maps. Using Google Maps means that you are able to find locations in Christchurch using the underlying map tiles and zoom in on the new aerial imagery.

Donate to the Christchurch Earthquake Appeal.

Live Mobile Videos on Google Maps

GeoCam.tv

GeoCam.tv is a Google Map of webcams from around the world. The site has recently added live streams from Qik.com. The videos from Qik.com are real-time video streams from users' mobile phones.

What I like about GeoCam.tv is that all the webcams can be viewed directly on the map. Currently the map shows over 1000 webcams from around the world, as well as the live Qik.com feeds. To view a cam just click on a map marker and the webcam image will open in an information window.

Friday, March 25, 2011

What is Trending on Google Maps

Trendero

Trendero is a new Google Maps based application that allows you to report on and follow trends around the world. Users of the application can report local trends and search the world to find what it is popular in other locations.

You can browse the map to search for trends in a number of categories. For example you can search for trends in music, film, books, fashion etc. Trends are assigned a trendiness score based on several factors, including: who reported the trend; how recently the trend was spotted; how actively users are updating the trend and how many people are looking at the trend.

Friday Fun with Google Maps

Justin Bieber & Google Earth

I think I've found someone with a better knowledge of Google Earth than Frank Taylor and Mickey Mellen from the Google Earth Blog.

I'm not exactly sure what is going on in this video. I think the guy has to guess from a zoomed in image what the satellite image is of. To try and put him off a small boy called Justin Bieber has been brought in to grin inanely in his direction.

Whatever is going on, from the reactions, the guy seems to be able to name every part of the world from a very zoomed in shot of Google Earth.


Mapping London

Using the before and after visualisation technique, used by ABC Australia and the New York Times to show photographs of the impact of the Japan Tsunami, Mapping London has put together an app to compare the recently updated imagery on Google Maps in London with imagery from 2002-6.

The new imagery clearly shows the the development in east London for the 2012 London Olympics.

Grrrr!

Google Sightseeing have discovered a baby black bear on Street View. The bear is spotted crossing the Stewart-Cassiar Highway in British Columbia, Canada.

Lights Out for the Sky at Night

GLOBE at Night Webapp

The GLOBE at Night organisation are endorsing the Earth Hour event on March 26 and would also like you to help them gather data as part of their research into light pollution.

To take part in the research you simply need to check the night sky and see if you can identify the constellation Leo or Crux. To help you find the constellations GLOBE at Night have provided a Google Map to determine your location and present you with several magnitude charts of the night sky.

All you need to do is determine which of the magnitude charts of the sky most resembles what you see and complete a short form.

Real-Time Instagram on Google Maps

Mapstagram

Mapstagram is a super-fast real-time Google Map of photos taken with the Instagram iPhone app.

When the Mapstagram map first loads it displays the most recent photos from a number of U.S. cities. After the initial photos have loaded Mapstagram goes into real-time mode. As photos are uploaded by users in these cities, they are immediately displayed on the map in real time.

Gramfeed

Gramfeed uses the Instagram API to present the best photos from Instagram on Google Maps. It also allows users to view their own photos, a time-line of those they follow, read comments on photos and Tweet about photos and much, much more.

Tuesday, March 22, 2011

Social Network - The Google Map

Xuland

Xuland is a Google Maps based social network that lets you share comments, pictures and links with those around you and search for venues, events and deals around your location.

Using Xuland you can comment on any location. If you like the comments of other Xuland users you can choose to 'follow' them. Xuland also has plans to offer comment badges soon to reward you for adding your thoughts.

You can also view nearby venues from Yelp, view deals for local venues from third party sites such as Groupon, and search for local events from Eventful. 

How Manhattan Grew on Google Maps

How Manhattan’s Grid Grew

In 1811, John Randel created a proposed street grid of Manhattan. The New York Times has created a Google Map that allows you to compare Randel's map to modern-day Manhattan.

The map also includes an 1836 map of the farms of Manhattan, a map of street openings since 1642 and historic census data. Each of the maps is supplemented by a transparency slider that allows you to view the modern map underneath.

The map of street openings since 1642 allows you to visualise the growth of Manhattan. If you use the time-line control you can watch the spread of Mahattan from just a few streets to the present urban sprawl.

Radiation Levels Mapped - Updated

Japan Radiation Maximum by Prefecture

The UN nuclear watchdog, the IAEA, warned today that the situation remains 'very serious' at the Fukushima nuclear power plant. Many Japanese citizens are therefore obviously worried about radiation levels.

This TargetMap creation uses Google Maps to show the real-time radiation levels by prefecture. The data comes from the the System for Prediction of Environment Emergency Dose Information(SPEEDI). The results shown are the maximum values recorded in the latest update.

RDTN.org Japanese Radiation Levels

RTDN have created a Google Map of radiation level readings in Japan with data from Pachube and Marian Steinbach.

Each marker on the map displays the radiation level and the time of the reading. RTDN are also looking for people to submit their own accurate readings to the map, which you can do via a short form.


To provide context for these map you should also check out O'Reilly Radar'sOpen Street Map visualisations of radiation levels in Japan. The O'Reilly maps compare two days of recent radiation data with the normal radiation levels in Japan.

Saturday, March 19, 2011

Friday Fun with Google Maps

 Limerick Crime Map


There was an Old Person of Cromer,
Who stood on one leg to read Homer;
When he found he grew stiff, he jumped over the cliff,
Which concluded that Person of Cromer.

The classic limericks of Edward Lear are full of appalling incidents (and even more appalling rhymes). Staircase3 has therefore decided that it is only fit to present his limerick's in the form of a crime map.

The limericks are marked on this Google Map by the given location of each main culprit.

Postcards from Google Earth: Bridges


Artist Clement Valla has created a series of postcards created from satellite images of bridges captured from Google Earth. The strange distortion of the bridges in the images does create some interesting and surreal views.

Drag & Drop Street View

This little Street View application lets you find the Street View for any location in the world and drag & drop images to create your own montage. The images available mainly consist of cartoon cars and women.

Friday, March 18, 2011

The Universe in Motion

 Google Sky & Chromeless Videos

We don't nearly see enough maps created with the amazing Google Sky. Here is my latest effort, and it's pretty impressive, even if I do say so myself.

This Sky Map overlays a number of celestial animations on top of Google Sky. I've used the YouTube API to show the videos in a chromeless player. The effect is pretty cool, creating an almost seamless overlay of the video on the map.

________________
Labels: 

45° Imagery Added to Google Maps API 3

Google's oblique aerial view imagery has now been added by default to maps created with the Google Maps API. When 45° imagery is available a submenu option is added to the Maps API Satellite button. In three weeks time aerial view, where available, will automatically become the default satellite view, as it is in the main Google Maps website.


You can see the cities where 45° imagery is currently available on this map.

In addition to the new 45° imagery an Overview Map Control is being added to maps created with the Google Maps API v3. This Overview Map Control is the small interactive thumbnail map you can see on the bottom right of Google Maps.

The addition of the Overview Map Control is the latest in some nice subtle changes Google have added to the design of Google Maps created with the API. Recently Google also changed the Google logo in API maps to a white logo instead of the usual multi-coloured logo and the buttons have also been made a lot more attractive.


Via: Google Geo Developers Blog

Brazilian Sports Facilities on Google Maps

Gatorade Maps

Here's a nice idea from the sports drink Gatorade. The company have created a useful Google Map to help Brazilian's find their nearest sports facilities. 

Using the map it is possible to find the nearest gyms, sports centres, walks and bike routes around a location. You can filter the results by location and by the type of sporting activity you are interested in.

To promote Gatorade the map also displays the nearest retail outlets that sell the sports drink.

Thursday, March 17, 2011

Wikipedia Chloropeth on Google Maps

Ragtag Map of Wikipedia Articles

The Ragtag blog has created a Google Map of every Wikipedia page tagged with a latitude and longitude. 424,171 articles in Wikipedia have been geotagged. You can see the geographical distribution of the articles in the heat map above.

Ragtag were also able to find 14,238 historical events that were geotagged on Wikipedia. By plotting the events by year and location Ragtag have managed to create a dynamic visualisation that gives a rough idea of the history of the world in 100 seconds.

Time-Lapse of the Japanese Earthquakes

Japan Quake Map

Paul Nicholls, the developer of the Christchurch Quake Map, has created an animated visualisation of all the Japanese earthquakes since March 11th.

The Google Map shows the magnitude and depth of each recorded quake. The size of the displayed polygons reflects the magnitude of each individual earthquake and its colour reflects the depth.

You can pause and resume the animation. A drop down menu also allows you to select to view the data for a specific day.

A Google Map of the World's Biggest Cocks

Worldwide Penis Size Map

According to this Google Map the men of Congo are the proud owners of the world's largest tadgers. If you want to know which men have the smallest peckers then you need to grab your magnifying glass and visit this user created Target Map.

A choropleth overlay gives you a quick overview of the world's willies. You can also click on individual countries to view the size of Bavarian beefsticks, Canadian cattle prods, Spanish salamis or Russian ramrods.

That's it, I'm out of euphemisms ...

Create Your Own Styled Google Map

FIND

FIND is the first Google Maps creation tool I've seen that allows the user to customise their created map using the Google Maps API Styled Maps functions.

Using FIND it is possible to add map markers, polylines, polygons, text and data from a number of sources to a Google Map. You can the style your map, changing the colours of all the map features to suit your preferences and then save your map to PDF.

The information that can be added to the map includes data from English and Scottish Heritage, the British Geological Survey, Natural England and the RSPB. Maps can be annotated with shapes, text, symbols and measuring tools and then saved to PDF in a neat print template.

A really nice feature of the tool is the ability to customise a Google Map through the 'Your Google Map' option. This feature utilises the Google Maps API Styled Maps functions. The 'Your Google Map' option allows users to change the colour of every feature on their Google Map to suit their specific requirements and preferences.

Nuclear Power Plants & Earthquake Activity

Nuclear Power Plants and Earthquakes Map

I've always wondered about the advisability of building nuclear power plants on top of fault lines.This Google Map shows global earthquake activity since 1973 and the locations of nuclear power plants around the world.

The map displays a heat map of 75,000 4.5+ magnitude earthquakes since 1973 based on data from the United States Geological Survey. I'm no expert but the map does make me question even more the advisability of building nuclear power stations in places such as Japan and California. 

Street View in Ads

The Canadian Tourism Commission and their creative agency DDB Canada are using Google Maps Street View in an online advertising campaign. The online ads use Street View to promote Canadian cities and tourist attractions.


You can view an example of one of the ads in this mock-up of The Guardian website. The ad in the example zooms in on Montreal on Google Maps before opening up a fully interactive Street View of Rue Bonsecours.

Each online ad ends by directing users to additional location-specific information on the Keep Exploring campaign site where they can further explore what each destination has to offer.

The campaign is currently running in Germany, France and the UK.

Tuesday, March 15, 2011

2011 NCAA Championship on Google Maps

Google College Basketball Tournament Map

Google has created a Google Map of the 14 arenas used for the 2011 NCAA Basketball Championship. The map includes all the schools involved, the schedules and the venues.

Also included is a distance tool so you can measure how far each school has to travel. There is even an option to switch on the Google Earth browser and view all 14 arenas in 3D.

If that isn't enough for you the map also contains a little game that lets you shoot some hoops yourself.


Via: Official Google Blog

New Satellite Images of Japan

Both The New York Times and ABC News have published before and after satellite imagery of the destruction caused by the Japanese earthquake and tsunami. Both visualisations use new imagery captured by the GeoEye satellite.

Google are working to provide this data directly to response organizations on the ground to aid their efforts.


From ABC News


From the NYT


You can donate to the Japanese Red Cross Society here. You can also donate to the Japanese Red Cross with Google Checkout at the Google Crisis Responsewebsite. 

Google Map Showing 100 Years of Cinema

100 Years of Set Locations

Do you ever wonder what films have been shot in your neighborhood? Well, with BoxOfficeQuant's new Google Map you can find all the movies that have been shot on location near your home.

The map displays the top 2,000 films from 1910-2010 according to IMDB. The location of sets used in each film was also obtained from IMDB. In total the map shows 9,736 locations from the 2,000 films.

The map uses Google Fusion Tables. It is a shame that BoxOfficeQuant didn't add the heat map option provided by Fusion Tables as it would be quite interesting to view the world's hot-spots for movie sets.

BoxOfficeQuant were even kind enough to respond to my wish to view a heat map of the locations used in the films.

Google Map of the World's Richest

Forbes Board
The Mapize team has created a nice visualisation of the Forbes Rich List.


As you can see the visualisation includes a fully interactive Google Map showing the location of the world's billionaires. You can filter the map to show the richest and the 'poorest' billionaires.

Monday, March 14, 2011

Google Maps Mania's Sunday Best

Marissa Mayer of Google this week revealed that 40% of Google Maps views were now on mobile devices. She also said that Google Maps mobile users had grown from 100 million in August 2010 to about 150 million mobile users.

With such an exponential growth of Google Maps users on mobile devices it is no surprise that Google Maps developers want to tap into that market.

This week's round-up of the best maps featured on Google Maps Mania once again is dominated by apps for the iPhone and Android phones. However I'm pleased to say we can start off with at least one desktop map.

Gramfeed

Gramfeed uses the Instagram API to present the best photos from Instagram and allows users to view their photos, a time-line of those they follow, read comments on photos and Tweet about photos and much, much more.

OpenSignalMaps

OpenSignalMaps is a great source for data about cell phone towers, cell phone signal strength readings, and Wi-Fi access points around the world. OpenSignalsMaps uses Google Maps to allow you to view the mobile signal strength for any location and view the locations of nearby towers for your carrier.

You can access OpenSignalMaps from your desktop but you should really download the app to your smart phone and help contribute to the collection of the data.

ToothTag

ToothTag is an app for Android phones that includes a number of very useful location services.

Using ToothTag it is possible to tag things and locations and receive notifications based on your proximity. For example you can tag where you have parked your car so that you can find it again without any problems. The application can also automatically check you in to a number of location based services, such as Foursquare or even alert you when friends are nearby.

Mobnotes


Mobnotes lets you share your location with friends, share your favourite places, search for venues around you and view other people in your vicinity. The application is available from the desktop and as an iPhone and Android app.

Sunday, March 13, 2011

Earthquake Pictures & Videos Mapped

NYT - Japanese Earthquake Map

This Google Map from the New York Times displays photographs of the havoc caused by yesterday's earthquake and tsunami. The map also contains information about locations affected by the quake.

YouTube Videos of the Japan Earthquake

Mibazaar has created a Google Map of geotagged YouTube videos of the Japanese earthquake. It is possible to view the videos from the map.

Japan Earthquake Photos

Google Earth Outreach have released this Google Map where anyone can share their photographs of the earthquake. The map has only just been created so, at the time of writing, no photographs have yet been added.

CNN - Earthquake Impact Map

CNN has put together a number of video reports, photos and stories about the Japanese earthquake on this Google Map.

Japan Earthquake Maps - Part Two

Google Crisis Response Map

The Google Crisis Response team has produced a Google Map to show the locations of shelters in Japan and the evacuation area around the Fukushima nuclear plant.

The map also includes layers to show the epicentre of the earthquake and the location of the tectonic plates.

CNN - Earthquake Impact Map

CNN has put together a number of video reports, photos and stories about the Japanese earthquake on this Google Map.

National Data Buoy Center Map

The NDBC uses Google Maps to show buoys in 'event' mode. Using the map you can view the measurements of water height for the last 5 days.

Using the map you can view the effect of yesterday's tsunami across the Pacific Ocean.

Earthquake Tweet Map

Mibazaar has rolled out his Tweet response map for the Japan Earthquake. The map allows you to view the latest real-time news from Japan as posted to Twitter. The map shows the latest Tweets concerned with the earthquake.

Seismic Activity in the Last 7 Days

This Google Maps from MapLarge shows seismic activity over the last 7 days. The map markers are color-coded and sized to reflect the strength of activity at different locations.

Also See

Japan Earthquake Maps

HTML5 Styling of Google Maps

Sparkgeo - Where Are You Demo

Sparkgeo has created a nice demo of an animated HTML5 radial gradient placed on top of a Google Map. The HTML5 canvas radial gradient adds a nice effect to the map and helps to focus the eye of the user on a particular location. However this won't work unless the user has a modern web browser (Internet Explorer users are likely to be disappointed).

Sparkgeo has even been kind enough to provide a tutorial on how the effect is created. Sparkgeo has also produced a tutorial on how to add labels to your map using the makerWithLabel.js extension, created by Gary Little, which can be found in the Google Maps Utility Library

To provide another demonstration of the gradient effect I've added it to this map of the London Blitz.