Wednesday, August 11, 2010

Visualise Your Foursquare Check-ins

Recently a lot of internet sites simultaneously discovered that you can visualise your foursquare check-ins on Google Maps. To see a map of your check-ins all you need to do is right click the KML link on the foursquare feeds page and copy it. Then you can paste the link into the search box in Google Maps and voilà - you have a map of your check-ins.

However this is not the only way to visualise your check-in history. There are actually a few applications that can help you create maps of your check-ins.

Wee Places
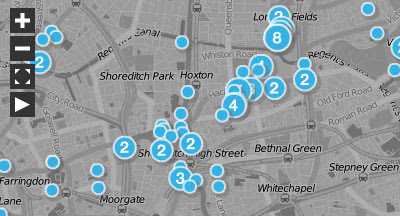
Wee Places is probably the best application I've seen for visualising your foursquare check-ins. I'm not sure what mapping service Wee Places is using, it doesn't look like Google Maps and there is no other map logo.

Wee Places provides a map of your check-ins and a time-line. The map animates through your time-line and zaps a yellow line between your check-ins as the time-line plays.

Once the time-line has come to an end you are left with a map of all your check-ins. The size of the map markers reflects the number of times you have checked-in at a venue and, if that is too confusing for you, the marker contains a number telling you the number of check-ins you made here.

4Mapper
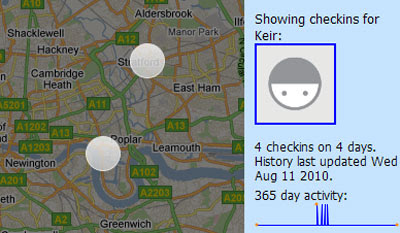
Not so visually attractive but effective none-the-less is 4Mapper. Sign into 4mapper with your foursquare account and you can view your check-ins on a Google Map.

4mapper lets you keep your map private or you can make it public and share your map with the world.

4sq Maps
4sq maps is another application that hasn't gone overboard on the design budget but it does have some very nice features.

4sq Maps uses different coloured map markers to show your check-ins, your mayorships and also shows you where your friends have checked-in. 4sq Maps can also provide a static image of your map so that you can place an image of your map in your own website or blog.

Tripline
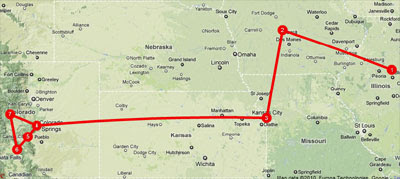
The wonderful Tripline, that I reviewed last week, also has an option to visualise your foursquare check-ins.

Tripline has some wonderful features that do make it a great way to visualise your check-ins. Unfortunately at the moment you can only import your last fifteen check-ins, so it is limited in scope.

Gowalla Walk
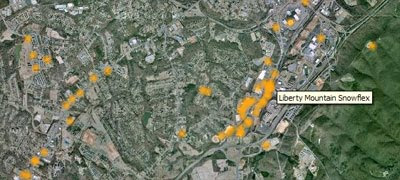
Just in case Gowalla users were beginning to feel left out there is one great Gowalla Google Map mashap. Gowalla Walk is a cool Google Map based application that lets you visualise your Gowalla check-ins.

To create your own Gowalla Walk map all you have to do is enter your username. All the places you have checked-in with Gowalla will then be shown on a Google Map. The locations visited are also listed under the map.

Finding TV Channels with Google Maps

TV Fool - TV Coverage Browser

TV Fool have created a Google Map to help you find all the available TV channels for your location. The map also shows the direction of transmitters in range to help you point your antenna.

To use the map just enter your address. The map will then display your location and list the available TV stations under the map. If you are unhappy with the position of the map marker you can drag it to the correct position. Each time you move the pointer, the list of channels and their predicted signal strengths will be updated automatically. It is also possible to change the height of the antenna.

Listed below the map are the transmitters within range of your location. If you select any of the transmitters, the map will load a coverage map overlay for that station and also display an information window with additional details about the selected transmitter.

Finding Topography Data with Google Maps

Open Topography Portal


The Open Topography Portal is a project that aims to provide access to various public domain airborne and terrestrial LiDAR, bathymetry, and other topographic data. As part of this project the Open Topography Portal has created a Google Map to show where topography datasets are available.

Available datasets are shown on the map by yellow polygons. If you click on the polygons you can learn about the available dataset at that location and see what data products are currently available. The classes of data types available include standard digital elevation models (DEMs), LiDAR point cloud data, and Google Earth files.

Tuesday, August 10, 2010

Street View in 20 German Cities


Google's German blog Der Google Produkt-Kompass has today revealed that Street View will be available later this year for 20 German cities. The cities are: Berlin, Bielefeld, Bochum, Bonn, Bremen, Dortmund, Dresden, Duisburg, Düsseldorf, Essen, Frankfurt am Main, Hamburg, Hannover, Köln, Leipzig, Mannheim, München, Nürnberg, Stuttgart and Wuppertal.

As well as using the usual face blurring on the German Street View Google are allowing German citizens to remove their house from the Street View imagery before it is released. Starting next week people can ask Google not to show their houses in Street View by filling in a form at google.de/streetview.

Alternatively you can always wait to see what your house looks like in Street View and then, if you don't want it shown, ask for it to be removed from Street View in the usual way (via the 'report a problem' link at the bottom of every Street View image).


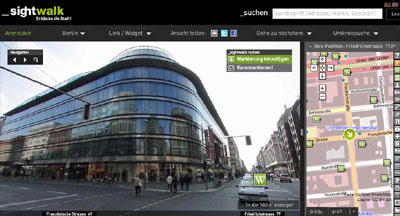
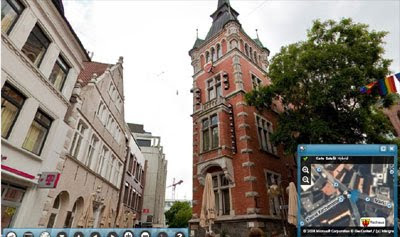
If you can't wait for Street View you can always check out German websiteSightwalk. Sitewalk already have a Street View type service for a number of German cities using OpenStreetMap. Or if that doesn't grab you then have a look at this Oldenburg Panorama-Tour, which uses the map that shall not be named (#cough Microsoft).


Via: Der Google Produkt-Kompass by way of Street View Funny

MCZ Project Interactive Map

MCZ (Marine Conservation Zone) Project Interactive Map

MCZ Project Interactive Map
Find a huge amount of maritime information, this example shows bathmetry and ship wrecks along the coast of the SW England..

But this map project goes much further:

This project has been jointly funded by Defra, Natural England and the Joint Nature Conservation Committee.
MCZ Project Interactive Map Marine Species
The map contains a huge resource of Marine and Coastal Zone data from Tide Wave Projects to reported Species of marine life surrounding the diverse waters of the United Kingdom.
What is the MCZ Project Interactive Map?
The Interactive Map is a web based Geographic Information System, which is essentially a way of displaying interactive maps online. The MCZ Project Interactive Map allows you to view maps of the United Kingdom and display additional relevant information above it, using layers selected from our marine spatial planning database. The tool also allows you add your own information to the map by drawing and labelling areas that you use or have information about. The MCZ Project Interactive Map is based around the Open Layers interface which is similar to Google Maps, and in many cases the controls will be exactly the same. This similarity will be become apparent as you start to use the tool.
We are using the Interactive Map to achieve two goals:
  1. To communicate the diversity and range of information that is being used by the MCZ Project. We hope that you find the investigation of the spatial data to be an interesting experience and that you discover more about the relationship between mankind and the coasts and seas of the United Kingdom.
  2. To collect information from commercial fishermen who are using the seas around England; however this may be extended to other stakeholder groups such as sea anglers and SCUBA divers. Using the Interactive Map, users can draw and label areas they use or places where they know certain species and habitats occur.
Map Help - and you can become and editor!
http://www.mczmapping.org/WebHelp.aspx#1

View the MCZ Project Interactive Map
http://www.mczmapping.org/#

This Map is another Open Street Map based project

New Google Earth Imagery - August 10

Google Earth has just rolled out some fresh imagery for us! Thanks to GEB reader 'Cristobal' for being the first to let us know about it.
ho-chi-minh-city.jpg
As is almost always the case, you can use Google Maps to determine for sure whether or not a specific area is fresh. This new imagery isn't in Google Maps yet, so you can compare Earth vs. Maps to see what's new; the fresh imagery is already in Google Earth, but the old imagery is still in Google Maps. If you compare the two side-by-side and they're not identical, that means that you've found a freshly updated area in Google Earth!
[UPDATED -- 10-August, 4:17pm EST]
  • Argentina: Buenos Aires -- thanks 'Cristobal'
  • Chile: Coquimbo and La Serena -- thanks 'Cristobal'
  • China: Dalian, Nanning -- thanks 'Cristobal'
  • United States: Chicago, IL -- thanks 'ChrisK'
  • Vietnam: Ho Chi Minh City -- thanks 'Cristobal'

Google still seeking map data for the Pakistan floods

As we've shown in the past, Google offers up fresh imagery as quickly as they can after a major disaster. The best recent example was the earthquake in Haiti, but other examples include the gulf oil spill and Chile earthquake.
Google is trying to update their imagery and maps in Pakistan in response to the recent floods, but they're having a hard time because it's too cloudy and satellites simply can't capture new imagery through the clouds.
pakistan-clouds.jpg
As a result, Google needs your help. They are "looking to collect and aggregate imagery and user generated KML, or other map data, with the goal of making this content more accessible to both crisis responders and the general public."
If you have any data that may be of value to them as they work to capture it all, please send it in.
The weather forecast for the country is becoming a bit more favorable, but still not excellent in the short term. If you happen to have data you can send that could be helpful to them, please do.

Finding Toys with Google Maps

Toys"R"Us

Store locators are often pretty dull affairs. Obviously the most important aspect of a store locator is its functionality. A store locator must be easy to use and help customers find nearby stores as quickly as possible. But that is no reason why a store locator shouldn't look good as well.

Toys"R"Us have designed a Google Maps based store locator that combines ease of use with an attractive design. One of the main aspects of this design is the use of the Toys"R"Us logo as the map markers. Replacing the default Google Maps markers with the store logo not only improves the map's design but also helps to promote the store's brand.

The design of the map is also helped by the use of custom map controls for the map view selection and zoom control. Coupled with the attractive design is the map's ease of use. To find a Toys"R"Us store with the map all you have to do is enter your address or zip-code and press enter.

Hat-tip: Mapperz

Google Map of Social Enterprises

OpenAction: Group Map

iuMAP is a tool to access information about 'bottom of the pyramid' social enterprises. The tool is a Google Map showing the location of sustainable businesses.

Each of the markers on the map represents a business that alleviates poverty through job creation in poor communities and / or by delivering products or services which satisfy an unmet social need such as healthcare, education, or energy.

If you click on a marker an information window opens with the name of the business and a short explanation of the nature of the business. The window also includes a link to read more about the business on OpenAction.org.

Crowd Sourced Crisis Mapping 2.0

Crowdmap
Ushahidi Map
Ushahidi's first incident reporting map of human rights abuses in Kenya

Since 2008 Ushahidi have been creating crowd sourced maps to document and report human rights abuses, election abuse and to provide crisis maps. At the heart of Ushahidi's platform is the mapping of crowd sourced incident reports provided by eye witnesses. One reason that Ushahidi maps have been so successful is that the platform allows for the submission of witness reports by SMS text, by e-mail or by web forms.

This ease of incident reporting has led to Ushahidi being used to map the political crisis in Madagascar, the spread of swine flu, the Chile earthquakeand the Haiti earthquake, to name but a few (there are three pages of results for a Google search of Ushaidi on Google Maps Mania).

Now Ushahidi have released Crowdmap to make it easier for anyone to set up their own crisis map. Ushahidi claims that it "takes all of five minutes to get a vanilla deployment up and running on crowdmap subdomain." Once you have established your Crowdmap domain you have full administrative access, just as you would if you installed it yourself. You have the ability to choose themes, edit categories and solicit reports.

Obviously Ushahidi are hoping that by creating a platform that requires little technical acumen and that can be implemented at speed that they are bringing the ability to create incident reporting maps to those most in need, on the ground.