Friday, December 3, 2010

Maps World on Mercator's Projection for sale


antique Chart of the World on Mercator's Projection

The World on Mercators Projection.
An original steel engraved map of the known world published for William Hughes pocket atlas circa 1860. It has some outline colouring as issued, with later colour wash.
Map image measures 180 x 240mm. Page size measure 215 x 280mm.

Map Mogul (antique maps).

Welcome to Map Mogul (antique maps).

Map Mogul Ltd supplies high quality original antiquarian maps and atlases from the 15th to 19th century. Maps by the most influential cartographers, over all periods, are represented in our catalogue. Our maps reflect the discovery of the world and the changes in the cartographic record over half a millennium.

We welcome enquiries from map enthusiasts, collectors, dealers and curators and those looking for an antique map as a research or scientific item. Please fill in our Contact Us form linked to this home page or contact us by telephone or e-mail.


Nova Totius Terrarum Orbis Geographica ac Hydrographica TabulaNova Totius Terrarum Orbis Geographica ac Hydrographica Tabula

Google Maps Readabilty

Google Maps & Label Readability

I'm a big fan of Justin O'Beirne's 41Latitude blog about maps, technology and usability. Justin's two posts on the Google Maps Styled Maps feature, Styled Maps Using Google Maps API Version 3 and Additional Examples of Styled Maps Using Google Maps API V3 are essential reading for anyone who wants to add a little style to their Google Maps creations.

Justin has posted a new article today on the readability of the major online map providers. The article provides some excellent analysis of the variety of techniques and visual tricks used by Google Maps to make its city labels much more readable than those of its competitors. The article is illustrated throughout with some excellent comparisons between Google Maps and its competitors, such as Bing Maps and Yahoo Maps.

Friday Fun with Google Maps

Create Your Own Planetarium

The problem with living in a major city is that light pollution ruins your appreciation of the stars. That's why urban stag-gazing has been invented.

Mapping a Day in Twitter
Chris McDowall has used Matplotlib with the Basemap extension to animate 25 hours of Tweets on a world map.


Streeview Names

Now that Street View blurs faces Google has decided to start adding name tags to people so that you can know who they are. Unfortunately, for those who want to be named, you have to have the name of a nearby store.

________________

Labels:

Google Earth continues to reveal strange sights from above

Over the years, we've seen a variety of interesting items revealed as result of Google Earth.

One of the most popular was the Swastika-shaped Navy Barracks that Frank first told you about in 2007. For years it was a simple building, but it gained fame once viewed from above, as it was clearly (though certainly unintentionally) shaped like a Nazi swastika.

Another great example was the huge scale model of China that was discovered. It represented an area that was occupied by China but claimed by India and was in dispute, and the model itself was nearly a square kilometer in size.

The latest example is the Star of David being discovered on the roof of the Iran Air headquarters. The building was constructed in 1979, and it seems that no one noticed the symbol until now. Unlike the Navy swastika building, this symbol was clearly intentional, though it's unclear who placed it there.

iran-air-star-of-david.jpg

Iranian government officials are quite upset by this, and plan to have it removed quickly. However, it may stay in Google Earth for a few years, or at least until the imagery in that area is updated again. If you'd like to see it for yourself, you can fly there using this KML file.

If you enjoy seeing strange items like this, there are a few categories full of fun items like this over at Google Earth Hacks: Crop Circles, Huge Man-Made Structures and Huge Symbols. You can also check out the great "20 Awesome Images Found in Google Maps" post by Search Engine Land,

For some Street View fun, try the Giant Items/Oddities category at GEH, or the Strange Thingscategory at StreetViewFun.

Google Earth Engine, an amazing tool for scientists and researchers, released at COP 16

Yesterday at the International Climate Change Conference, Google released a mountain of data for scientists around the world to analyze and use. Known as "Google Earth Engine", it gives researchers access to this huge pile of data, along with computing power to deal with all of it.

The data includes Landsat satellite data and "trillions of scientific measurements" covering the past 25 years.

So what can be done with all of this data? Thanks to some launch partners, there are already a handful of projects underway. For example, below is a map showing the loss of forest cover in the Congo for the past 10 years, taken from the Earth Engine Map Gallery.

congo.jpg

To go along with this, Google is also donating 10 million CPU-hours for each of the next two years, to help developing nations track the state of their forests. This is in anticipation forREDD (Reducing Emissions from Deforestation and Forest Degradation in Developing Countries), which offers financial incentives for tropical nations that protect their forests.

Do you plan to use Google Earth Engine? If not, what would you use it for if you had the chance?

Thursday, December 2, 2010

Find a Snowboard with Google Maps

urton Snowboards - Dealer Locator

Burton Snowboards has used the Google Maps for Flash API to provide an impressive store locator.

Using the store locator you can find a Burton store near you by entering your address in the search box. The stores closest to your address are then listed in the map sidebar. If you click on one of the listed stores the map pans and rotates to show the chosen store.

The information window for each store includes the name and address of the store and a link to get directions to the store.

Real-Time Streetcars on Google Maps

Where is my Streetcar?

This Google Map shows the real-time position of streetcars in Toronto.

Using the map you can find out how long you will have to wait for a streetcar at any of the city's stops. You can select your stop from a drop-down menu at the top of the map and you can choose to view either westbound or southbound streetcars or both.

The real-time position of the streetcars are then displayed on the map with arrows that display their direction of travel. The map uses City of Toronto Open Data, using feeds provided by NextBus and the TTC.

The whole project is open source, so if you think you can improve the map you can view and edit the source.

Introducing Google Earth Engine

Today, we launched a new Google Labs product called Google Earth Engine at theInternational Climate Change Conference in sunny Cancun, Mexico. Google Earth Engine is a new technology platform that puts an unprecedented amount of satellite imagery and data—current and historical—online for the first time. It enables global-scale monitoring and measurement of changes in the earth’s environment. The platform will enable scientists to use our extensive computing infrastructure—the Google “cloud”—to analyze this imagery. Last year, we demonstrated an early prototype. Since then, we have developed the platform, and are excited now to offer scientists around the world access to Earth Engine to implement their applications.

Why is this important? The images of our planet from space contain a wealth of information, ready to be extracted and applied to many societal challenges. Scientific analysis can transform these images from a mere set of pixels into useful information—such as the locations and extent of global forests, detecting how our forests are changing over time, directing resources for disaster response or water resource mapping.

The challenge has been to cope with the massive scale of satellite imagery archives, and the computational resources required for their analysis. As a result, many of these images have never been seen, much less analyzed. Now, scientists will be able to build applications to mine this treasure trove of data on Google Earth Engine, providing several advantages:
  • Landsat satellite data archives over the last 25 years for most of the developing world available online, ready to be used together with other datasets including MODIS. And we will soon offer a complete global archive of Landsat.
  • Reduced time to do analyses, using Google’s computing infrastructure. By running analyses across thousands of computers, for example, unthinkable tasks are now possible for the first time.
  • New features that will make analysis easier, such as tools that pre-process the images to remove clouds and haze.
  • Collaboration and standardization by creating a common platform for global data analysis.
Google Earth Engine can be used for a wide range of applications—from mapping water resources to ecosystem services to deforestation. It’s part of our broader effort at Google tobuild a more sustainable future. We’re particularly excited about an initial use of Google Earth Engine to support development of systems to monitor, report and verify (MRV) efforts to stop global deforestation.

Deforestation releases a significant amount of carbon into the atmosphere, accounting for 12-18% of annual greenhouse gas emissions. The world loses 32 million acres of tropical forests every year, an area the size of Greece. The United Nations has proposed a framework known as REDD (Reducing Emissions from Deforestation and Forest Degradation in Developing Countries) that would provide financial incentives to tropical nations to protect their forests. Reaching an agreement on early development of REDD is a key agenda item here in Cancun.

Today, we announced that we are donating 10 million CPU-hours a year over the next two years on the Google Earth Engine platform, to strengthen the capacity of developing world nations to track the state of their forests, in preparation for REDD. For the least developed nations, Google Earth Engine will provide critical access to terabytes of data, a growing set of analytical tools and our high-performance processing capabilities. We believe Google Earth Engine will bring transparency and more certainty to global efforts to stop deforestation.

Over the past two years, we’ve been working with several top scientists to fully develop this platform and integrate their desktop software to work online with the data available in Google Earth Engine. Those scientists—Greg Asner of the Carnegie Institution for Science, Carlos Souza of Imazon and Matt Hansen of the Geographic Information Science Center at South Dakota State University—are at the cutting edge of forest monitoring in support of climate science.

In collaboration with Matt Hansen and CONAFOR, Mexico’s National Forestry Commission, we’ve produced a forest cover and water map of Mexico. This is the finest-scale forest map produced of Mexico to date. The map required 15,000 hours of computation, but was completed in less than a day on Google Earth Engine, using 1,000 computers over more than 53,000 Landsat scenes (1984-2010). CONAFOR provided National Forest Inventory ground-sampled data to calibrate and validate the algorithm.

A forest cover and water map of Mexico (southern portion, including the Yucatan peninsula), produced in collaboration with scientist Matthew Hansen and CONAFOR.
We hope that Google Earth Engine will be an important tool to help institutions around the world manage forests more wisely. As we fully develop the platform, we hope more scientists will use new Earth Engine API to integrate their applications online—for deforestation, disease mitigation, disaster response, water resource mapping and other beneficial uses. If you’re interested in partnering with us, we want to hear from you—visit our website! We look forward to seeing what’s possible when scientists, governments, NGO’s, universities, and others gain access to data and computing resources to collaborate online to help protect the earth’s environment.

Google Earth Pro 6: Measure your world in 3D

We’re excited to announce a new addition to the Advanced Measurement Tool Suite in Google Earth Pro: you can now measure in 3D!

Pro customers recently ranked Area Measurement as one of the most valuable Google Earth Pro tools, so we wanted to add more to the package. In a continued effort to mirror the real world, allowing you to lift measurements off the ground and extend them in to the 3D realm seemed a natural next step.

We think these tools will be beneficial to our customers as there are limitless applications for their use. 3D Measurements can be used by engineers to plan wind farms, real estate firms to determine skyline views for new high rise buildings, construction companies to measure the materials needed for a retrofitting, architects to calculate the space between buildings, and more.

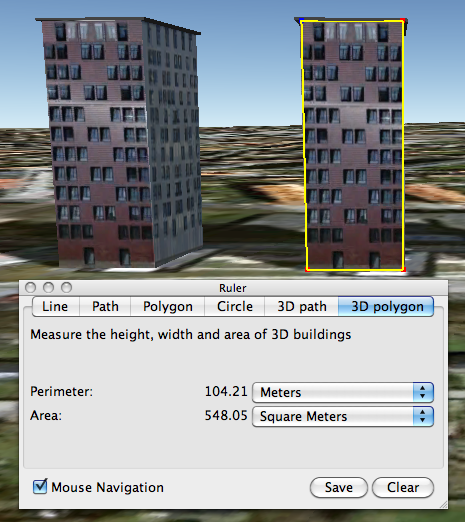
To measure buildings and distances between buildings, just turn on the 3D Buildings layer and click the Ruler Tool icon in the toolbar. If you’re running Google Earth Pro, you’ll notice two new tabs for measuring in 3D: 3D Path and 3D Polygon.

Here are a few examples of what the new Pro 3D Measurement Tools have to offer.

Measure the height or width of a 3D building:


Measure the area of the face of a 3D building:


Measure the distance between a building and a point on the ground or another building:


If you’re new to Google Earth Pro, try it for free for 7 days or buy Google Earth Pro today and discover how 3D Measurements can benefit your business. Onward and upward!