Mapbiquity
Mapbiquity is a Google Maps based creation tool that can help you create a Google Map for your website.
Mapbiquity helps you build a map with your own data. To create a map all you really need to do is upload some Shapefile data. You can then style the map to fit the design of your website.
When you have completed you map you can then add it to your site by cutting and pasting a short piece of code.
Tuesday, December 21, 2010
Monday, December 20, 2010
Where Will You Watch the Lunar Eclipse?
Event Map: Where Will You Be?

NASA have created a Google Map so that you can share where you will be watching tonight's total lunar eclipse. NASA hopes to build a community of moon-gazers across the country by everyone sharing their lunar eclipse viewing spots, comments and photos.
You can add yourself to the moon-gazing map by entering your 10-digit cell phone number on the NASA website. NASA will then text you with tips and resources for viewing the eclipse. You can then text NASA your zip code and they will add you to the map.
Remember you can also tune into NASA's live video feed of the eclipse and view a simulation of the eclipse on the Google Earth browser with HeyWhatsThat's Event Map: Where Will You Be?
Regional Accents on Google Maps
Map Your Voice

The British Library has created a Google Map to record and map English accents around the world.
The British Library are asking people all over the world to read and record the children's story 'Mr. Tickle' by Roger Hargreaves. The story has been chosen for the range of English sounds it contains when read out loud.
You can listen to the recordings already made by clicking on the map markers on the map and pressing play on the embedded audio player.
This isn't the first sound map produced by The British Library. The UK SoundMap is a Google Map of soundscapes captured around the UK.
Via: ReadWriteWeb
Telling Stories with Google Maps
MapSkip

MapSkip is an interesting Google Map that allows users to map stories about places. The stories can be about the place you fell in love, where you had a dream vacation or where you took a great picture. Alternatively your stories can be about the places that are important in your life, such as where you live, eat, work and have fun.
MapSkip has a community of over 1,000 registered users and has mapped over 1,200 stories. MapSkip is particularly popular with many schools and teachers. The site allows teachers to create student accounts and adjust settings so that students' work is not visible to others. A Teacher's Interface also allows teachers to review stories submitted by their students.
The MapSkip map of submitted stories can be filtered to show only your added stories and places, to display only your favourited stories, or only stories that have sound or video.
Sunday, December 19, 2010
Create a Google Map in 60 Seconds
TIXIK.com

If you need to create a simple Google Map then TIXIK.com can help. Using this map creator you can create an embeddable map for your website in a matter of seconds.
To create a map you just need to enter a location. A Google Map showing the location is then displayed with the code to embed the map on a website. If the location needs adjusting you can drag the map marker to the correct position.
TIXIK.com also allows you to adjust the height and width of your map, set the map type, the zoom level and adjust the map border.
The Lunar Eclipse Simulator
HeyWhatsThat: Eclipses

Early in the morning of December the 21st, on the winter solstice, there will be a total lunar eclipse. If you live in North America you should have great views of the eclipse. If you live in Western Europe you should be able to see the beginning of the eclipse.
HeyWhatsThat: Eclipses uses the Google Earth plug-in to simulate solar and lunar eclipses. Using Eclipses you can watch a simulation of the lunar eclipse from your location. Use the timeline beneath the Google Earth plug-in to view the eclipse at different times during the night.
If you live in the southern hemisphere you can enjoy the summer solstice. However you can also tune into NASA's live video feed of the eclipse.
usa maps
Map of the USA that is compatible with the Tag™ reading system. Loaded with facts about individual states and regions. For ages 4 - 7.
Saturday, December 18, 2010
Imagery Update - Week of December 12th
‘Tis the season of giving! For those of you who’d like nothing more than to receive the gift of new places to explore on Google Earth and Maps, you’re in luck. Our imagery team’s latest update includes many places that relate metaphorically to the holiday season.
For example, it’s often at the end of the year that we remark “Out with the old, and in with the new.” That concept can also be applied to the below image that captures two military installations located North West of Beijing. You can see the fascinating juxtaposition of the modern Yongning Air Force base (bottom right) and an adjacent section of the ancient Great Wall of China (upper left quadrant) that outlines parts of the Shibapan Ling mountain range. And yes, you really can see the wall from space!
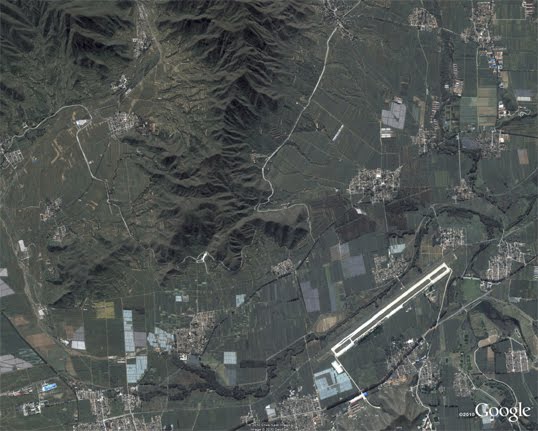
Near Beijing, China
Wouldn’t gold make a great stocking stuffer? Take a look at the below image of Jin Xixin Lake, the dammed section of the Minjiang River also known as the Gold Lake, located south of Mount Wuyi, China. In this image, you can see lots of prime locations that might make great prospecting camps. Get out your pans!

Gold (but no frankincense) near Mount Wuyi, China
Finally, although this time of year is often associated with the Christian-based holidays, when thinking about China, thoughts naturally turn to Buddhism. Just the other day on the Google campus in Mountain View, a group of Tibetan monks visited to build a Sand Mandala and lead a meditation group. In this spirit, I’ve included the below image of the first Buddhist monastery built in Tibet, the Samye Monastery.

A site of enlightenment in Tibet
The examples above only hint at the type and breadth of features that can be seen and discovered in our latest batch of published imagery. Happy exploring and happy holidays!
High resolution aerial updates:
USA: Birmingham AL, Little Rock AK, Peoria IL, Tuscaloosa AL, Worcester MA, Jerome ID, Stevenson WA, Knoxville TN, Morganton NC, and Statesville NC
Canada: Powell River, and Sunshine Coast, BC., Canmore, and Cold Lake
Netherlands: Hilversum
South Africa: Northern, Eastern, and Western Cape, and Limpopo
Sweden: Gävleborgs Län, Jönköpings Län, Uppsala Län, Västerbottens Län, and Västra Götalands Län
Countries receiving high resolution satellite updates:
Albania, Algeria, Angola, Argentina, Armenia, Australia, Austria, Azerbaijan, Bahrain, Bangladesh, Belgium, Bhutan, Bolivia, Bosnia and Herzegovina, Botswana, Brazil, British Virgin Islands, Brunei Darussalam, Bulgaria, Burkina Faso, Cambodia, Cameroon, Canada, Chad, Chile, China, Colombia, Costa Rica, Croatia, Cuba, Democratic People's Republic of Korea, Democratic Republic of the Congo, Denmark, Dominican Republic, Ecuador, El Salvador, Estonia, Ethiopia, Finland, France, Georgia, Germany, Greece, Guatemala, Haiti, Honduras, Hungary, India, Indonesia, Iran, Ireland, Israel, Italy, Japan, Jordan, Kazakhstan, Kenya, Kuwait, Kyrgyzstan, Laos, Latvia, Lesotho, Liberia, Libya, Lithuania, Luxembourg, Madagascar, Malawi, Malaysia, Mali, Mauritania, Mexico, Mongolia, Montenegro, Morocco, Mozambique, Myanmar, Namibia, Nepal, Netherlands, New Caledonia, New Zealand, Nigeria, Norway, Oman, Pakistan, Panama, Papua New Guinea, Paraguay, Peru, Philippines, Poland, Portugal, Puerto Rico, Republic of Korea, Romania, Russia, Samoa, Saudi Arabia, Senegal, Serbia, Slovakia, Slovenia, Solomon Islands, South Africa, Spain, Sri Lanka, Sudan, Sweden, Switzerland, Syria, Taiwan, Tajikistan, Tanzania, Thailand, Turkey, Turkmenistan, Uganda, Ukraine, United Arab Emirates, United Kingdom, United States, Uruguay, Uzbekistan, Venezuela, Vietnam, Virgin Islands, West Bank, Yemen, Zambia, Zimbabwe
These updates are currently only available in Google Earth, but they'll also be in Google Maps soon. To get a complete picture of where we updated imagery, download this KML for viewing in Google Earth.
The Antique Map for your iPhone
The Cartographer
The Cartographer is an iPhone app that combines an antique map style with custom Google My Maps viewing and editing.
The unique selling point of The Cartographer has to be its unique antique map design but it also has a number of other useful features. The Cartographer syncs well with Google My Maps. You can create Google My Maps from your desktop and the resulting maps can be effortlessly accessed and edited on the iPhone.
Users can also access The Cartographer offline and so avoid data and roaming charges.
________________
Labels: iPhone
Under the hood of Google Maps 5.0 for Android
Yesterday we introduced Google Maps 5.0 for Android with two significant new features: 3D interaction and offline reliability. In order to create these features, we rebuilt Maps using vector graphics to dynamically draw the map as you use it. Building a vector graphics engine capable of achieving the visual quality and performance level you expect from Google Maps was a major technical challenge and enables all sorts of future possibilities. So we wanted to give you a closer look under the hood at the technology driving the next generation of mobile maps.
Vector graphics
Before diving into how Maps uses vector graphics, it may be helpful to understand how maps were created before. Previously, Google Maps downloaded the map as sets of individual 256x256 pixel “image tiles.” Each pre-rendered image tile was downloaded with its own section of map imagery, roads, labels and other features baked right in. Google Maps would download each tile as you needed it and then stitch sets together to form the map you see. It takes more than 360 billion tiles to cover the whole world at 20 zoom levels!
Now, we use vector graphics to dynamically draw the map. Maps will download “vector tiles” that describe the underlying geometry of the map. You can think of them as the blueprints needed to draw a map, instead of static map images. Because you only need to download the blueprints, the amount of data needed to draw maps from vector tiles is drastically less than when downloading pre-rendered image tiles. Google Maps isn’t the first mobile app to use vector graphics—in fact, Google Earth and our Navigation (Beta) feature do already. But a combination of modern device hardware and innovative engineering allow us to stream vector tiles efficiently and render them smoothly, while maintaining the speed and readability we require in Google Maps. Just try it out and see for yourself!
One map, many perspectives
Using vector tiles instead of image tiles gives Maps the flexibility to re-draw the same map from different perspectives using the same set of data. Zooming is one example of this at work. If you magnify an map image tile by 2x, lines such as roads and text would get twice as wide and appear blurry. As a result, we had to constrain Maps to 20 fixed “zoom levels,” each one twice as close as the last. Every time you zoomed in further, you’d need to download a completely new set of image tiles. It took time to load new data over a mobile data connection, and would fail when you lost your connection in a subway or large building.


With vector graphics, you no longer need to “round” to the nearest zoom level and then download all the tiles for that level. One vector tile has the underlying vector data (or blueprints) to draw the map at many different levels of scale. So when you zoom, the map stops when your fingers stop, and roads and labels always stay crisp. This same technique powers the new 3D map interactions: tilt, rotate and compass mode. Just like with zooming, Maps uses the same vector data to draw the map from any angle or direction as you tilt or rotate.
We can also display entirely new levels of detail that weren’t possible with flat image tiles. For example, in the 100+ cities where we have 3D building data, each building is drawn in 3D using a polygonal building footprint and heights for different parts of the building. And with tilt and rotate, you can see them from a variety of different angles.
Reading the map
Just like other map features, labels are dynamically drawn so they continue to face you and stay legible if you rotate the rest of the map or use compass mode. Maps also “chooses” the best labels to show you based on several factors. You’ll notice labels fade in and out as you interact with the map so that the most useful ones appear and the map never gets too cluttered.


Vector graphics also allow us to draw additional data on the map more clearly. For example, traffic or transit lines no longer block the labels beneath them. We can also draw the same map in different styles—like “satellite view” where the roads are translucent over aerial imagery, or Navigation’s “night mode” where a darker palette helps your eyes adjust quickly in the lower light.


Offline reliability
Vector graphics also enable another significant new feature: the ability to continue viewing maps even when you have poor—or no—network connections. Because each vector tile works across multiple zoom levels, it requires more than 100 times less data to view maps across all zoom levels than before, allowing Maps to cache much larger areas of the map on your device.
With this first version, Maps proactively caches map data for the places you use Maps the most—where you’re actively using it as well as places for which you search or get directions. Then when you’re plugged in and connected over WiFi, caching happens automatically. Near your frequent places, you’ll get detailed vector tiles for city-sized regions so you can see every road labeled. Further away, you’ll have less detail but will typically have towns and highways labeled for miles. We’re continuing to work on these algorithms, so you’ll see improvements over time.
Offline rerouting
With Google Maps Navigation (Beta), you’ll also see the benefits of additional caching with offline rerouting. This feature is only possible because Navigation caches not only map data but also data like turn restrictions for the areas surrounding your route. You’ll still need to be connected when you first start a trip to download and cache your route. But this way, even if you take a wrong turn after losing your connection, Navigation can use the cached data to get you back on your way. We will be rolling this feature out gradually over the next few weeks.
This is just the start, and we’re really excited about all the possible ways to use vector graphics technology for the next generation of Google Maps. So please stay tuned!
Vector graphics
Before diving into how Maps uses vector graphics, it may be helpful to understand how maps were created before. Previously, Google Maps downloaded the map as sets of individual 256x256 pixel “image tiles.” Each pre-rendered image tile was downloaded with its own section of map imagery, roads, labels and other features baked right in. Google Maps would download each tile as you needed it and then stitch sets together to form the map you see. It takes more than 360 billion tiles to cover the whole world at 20 zoom levels!
Now, we use vector graphics to dynamically draw the map. Maps will download “vector tiles” that describe the underlying geometry of the map. You can think of them as the blueprints needed to draw a map, instead of static map images. Because you only need to download the blueprints, the amount of data needed to draw maps from vector tiles is drastically less than when downloading pre-rendered image tiles. Google Maps isn’t the first mobile app to use vector graphics—in fact, Google Earth and our Navigation (Beta) feature do already. But a combination of modern device hardware and innovative engineering allow us to stream vector tiles efficiently and render them smoothly, while maintaining the speed and readability we require in Google Maps. Just try it out and see for yourself!

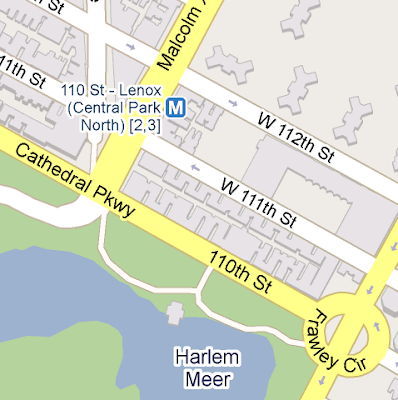
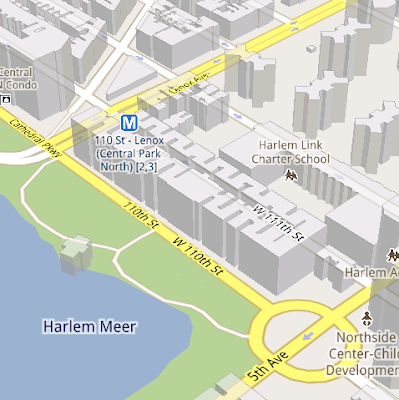
See the difference between image tiles (left) and vector tiles (right) tilted to show 3D buildings.
One map, many perspectives
Using vector tiles instead of image tiles gives Maps the flexibility to re-draw the same map from different perspectives using the same set of data. Zooming is one example of this at work. If you magnify an map image tile by 2x, lines such as roads and text would get twice as wide and appear blurry. As a result, we had to constrain Maps to 20 fixed “zoom levels,” each one twice as close as the last. Every time you zoomed in further, you’d need to download a completely new set of image tiles. It took time to load new data over a mobile data connection, and would fail when you lost your connection in a subway or large building.


Compared to image tiles (left), vector tiles (right) keep lines and labels crisp as you zoom.
We can also display entirely new levels of detail that weren’t possible with flat image tiles. For example, in the 100+ cities where we have 3D building data, each building is drawn in 3D using a polygonal building footprint and heights for different parts of the building. And with tilt and rotate, you can see them from a variety of different angles.
Reading the map
Just like other map features, labels are dynamically drawn so they continue to face you and stay legible if you rotate the rest of the map or use compass mode. Maps also “chooses” the best labels to show you based on several factors. You’ll notice labels fade in and out as you interact with the map so that the most useful ones appear and the map never gets too cluttered.


See the difference between rotating maps with static labels (left) and dynamic labels (right).


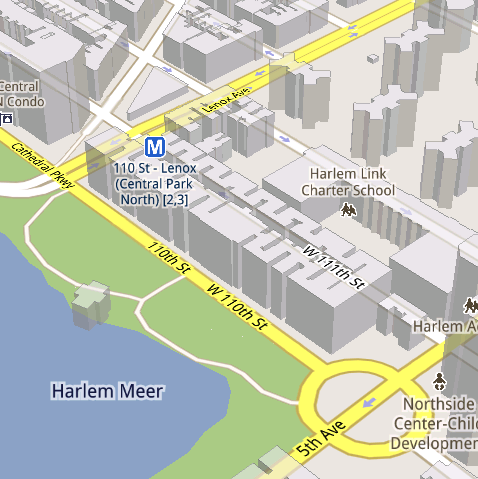
Previously, map features like labels and traffic could conflict (left) instead of blend seamlessly (right).
Offline reliability
Vector graphics also enable another significant new feature: the ability to continue viewing maps even when you have poor—or no—network connections. Because each vector tile works across multiple zoom levels, it requires more than 100 times less data to view maps across all zoom levels than before, allowing Maps to cache much larger areas of the map on your device.
With this first version, Maps proactively caches map data for the places you use Maps the most—where you’re actively using it as well as places for which you search or get directions. Then when you’re plugged in and connected over WiFi, caching happens automatically. Near your frequent places, you’ll get detailed vector tiles for city-sized regions so you can see every road labeled. Further away, you’ll have less detail but will typically have towns and highways labeled for miles. We’re continuing to work on these algorithms, so you’ll see improvements over time.
Offline rerouting
With Google Maps Navigation (Beta), you’ll also see the benefits of additional caching with offline rerouting. This feature is only possible because Navigation caches not only map data but also data like turn restrictions for the areas surrounding your route. You’ll still need to be connected when you first start a trip to download and cache your route. But this way, even if you take a wrong turn after losing your connection, Navigation can use the cached data to get you back on your way. We will be rolling this feature out gradually over the next few weeks.
This is just the start, and we’re really excited about all the possible ways to use vector graphics technology for the next generation of Google Maps. So please stay tuned!
Subscribe to:
Posts (Atom)